


Interactive digital signage transforms static one-way communication into dynamic, engaging experiences where visitors actively control their journey through content via intuitive touchscreen technology. Unlike traditional displays that broadcast predetermined messages to passive audiences, interactive systems invite exploration, enable personalized discovery pathways, and create memorable experiences that extend dwell time while delivering measurable engagement that validates technology investments. Whether managing school lobbies, museum galleries, corporate reception areas, or community centers, understanding how touchscreen interactivity fundamentally changes visitor behavior—and implementing systems that capitalize on these behavioral shifts—ensures digital signage delivers genuine value rather than becoming expensive digital bulletin boards that communities quickly learn to ignore.
Yet many organizations discover that simply adding touchscreens to existing digital signage strategies fails to generate expected engagement. Effective interactive installations require rethinking content architecture for exploration rather than broadcast, designing intuitive interfaces that users navigate without instruction, developing sufficient content depth that rewards extended interaction, strategically placing displays where visitors have discretionary time and attention, and measuring engagement to validate impact and inform continuous refinement. Institutions rushing toward interactive technology without addressing these fundamental shifts typically create underutilized installations that frustrate users and disappoint stakeholders—while those implementing systematically build valuable engagement platforms that serve diverse audiences simultaneously.
This comprehensive guide explores every dimension of interactive digital signage—from understanding core engagement advantages and overcoming implementation challenges through selecting appropriate technologies, architecting explorable content, designing intuitive experiences, measuring success, and sustaining programs long-term. Whether launching first interactive installations or enhancing existing static signage with engagement capabilities, these proven strategies ensure investments deliver meaningful results for visitors, administrators, and communities.
Organizations today compete for increasingly scarce attention amid overwhelming information density. Traditional static signage—whether physical posters or broadcast digital displays—struggles to capture sustained engagement from audiences conditioned by smartphones and tablets to expect personalized, on-demand information access. Interactive digital signage addresses this fundamental challenge by transforming passive viewing into active participation where visitors control what they explore, how deeply they engage, and which pathways they follow through available content.

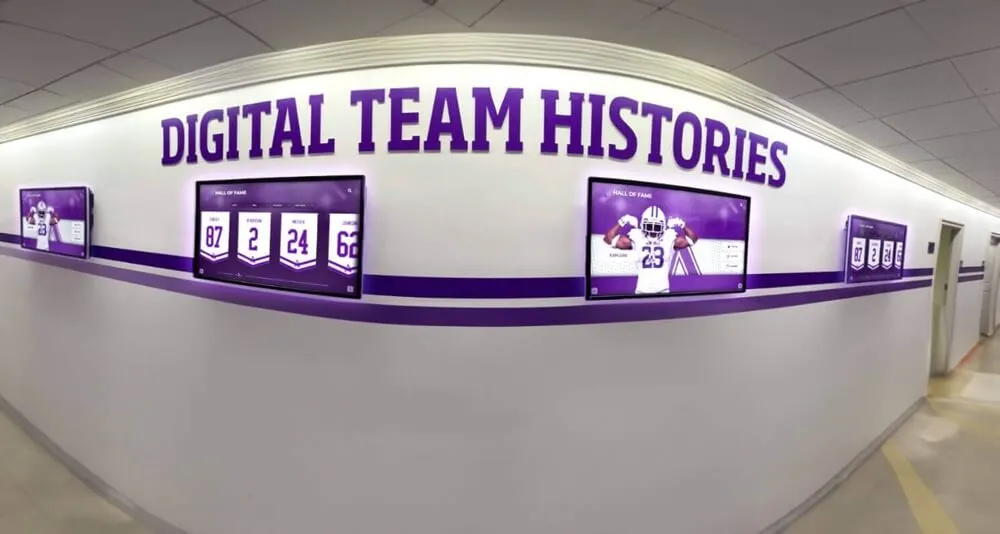
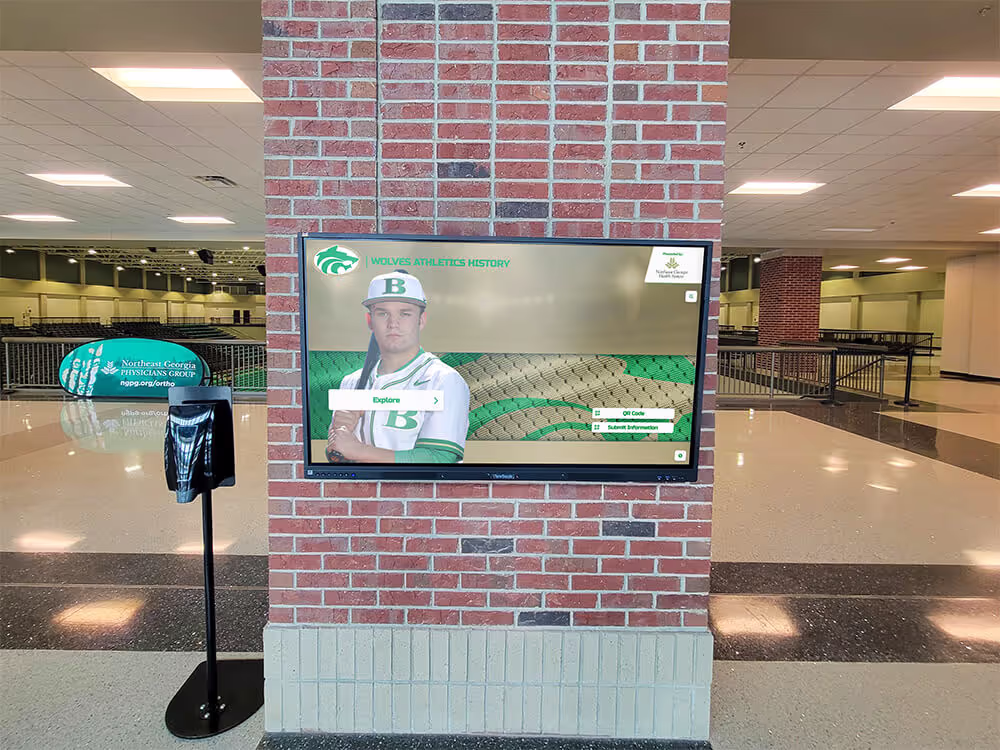
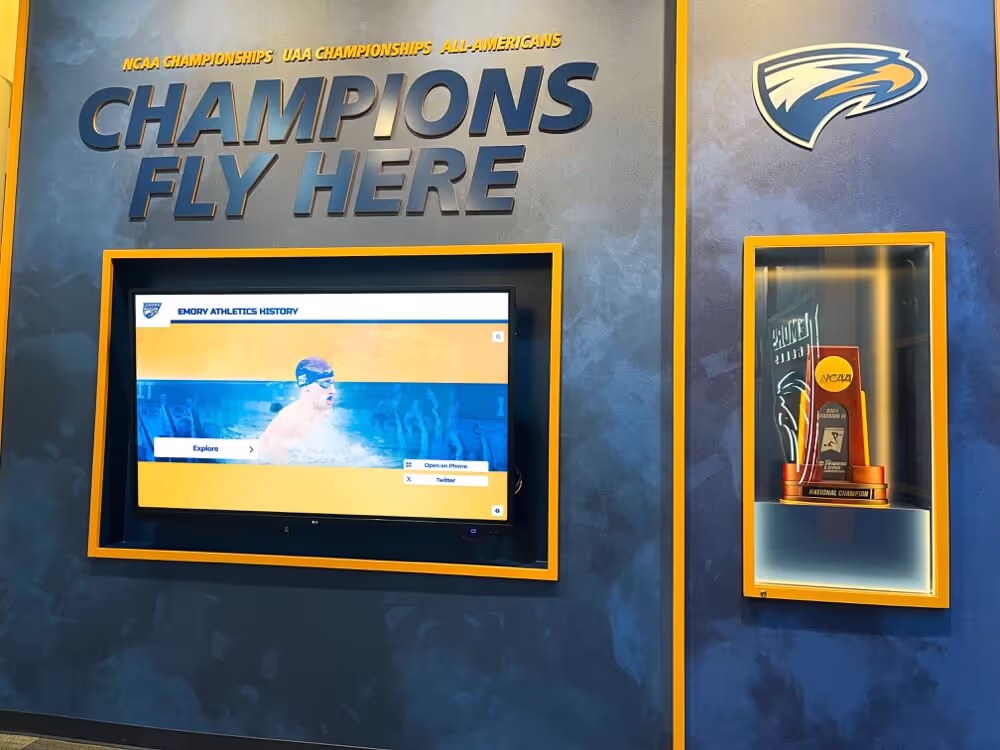
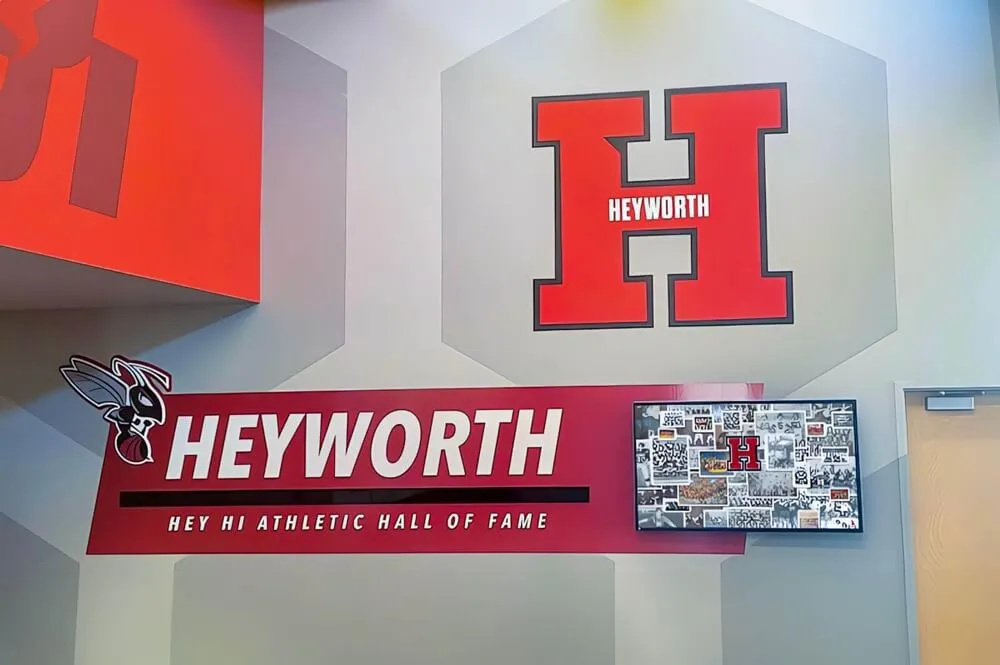
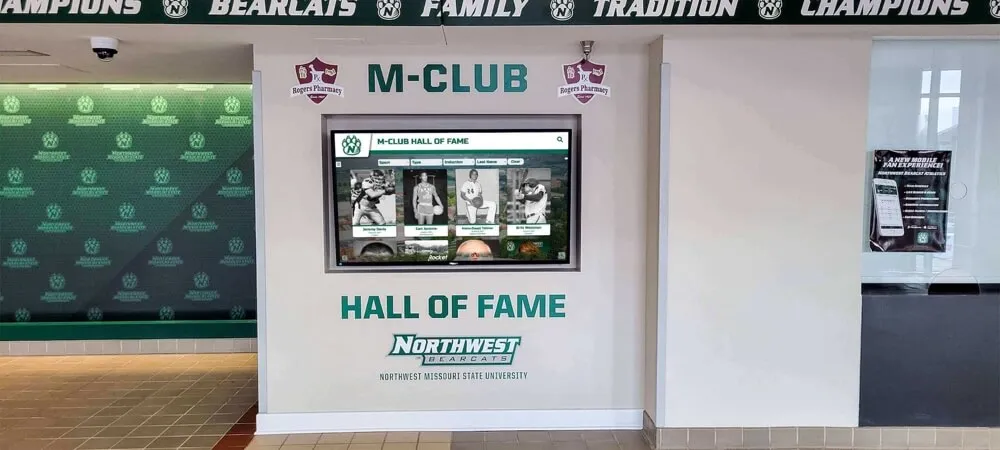
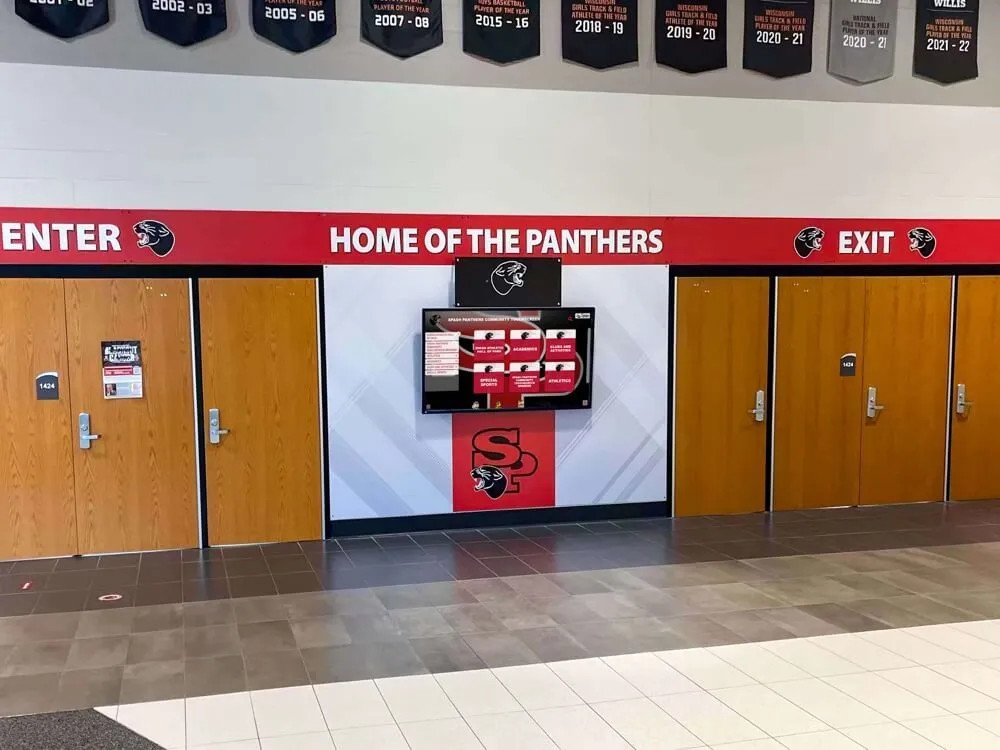
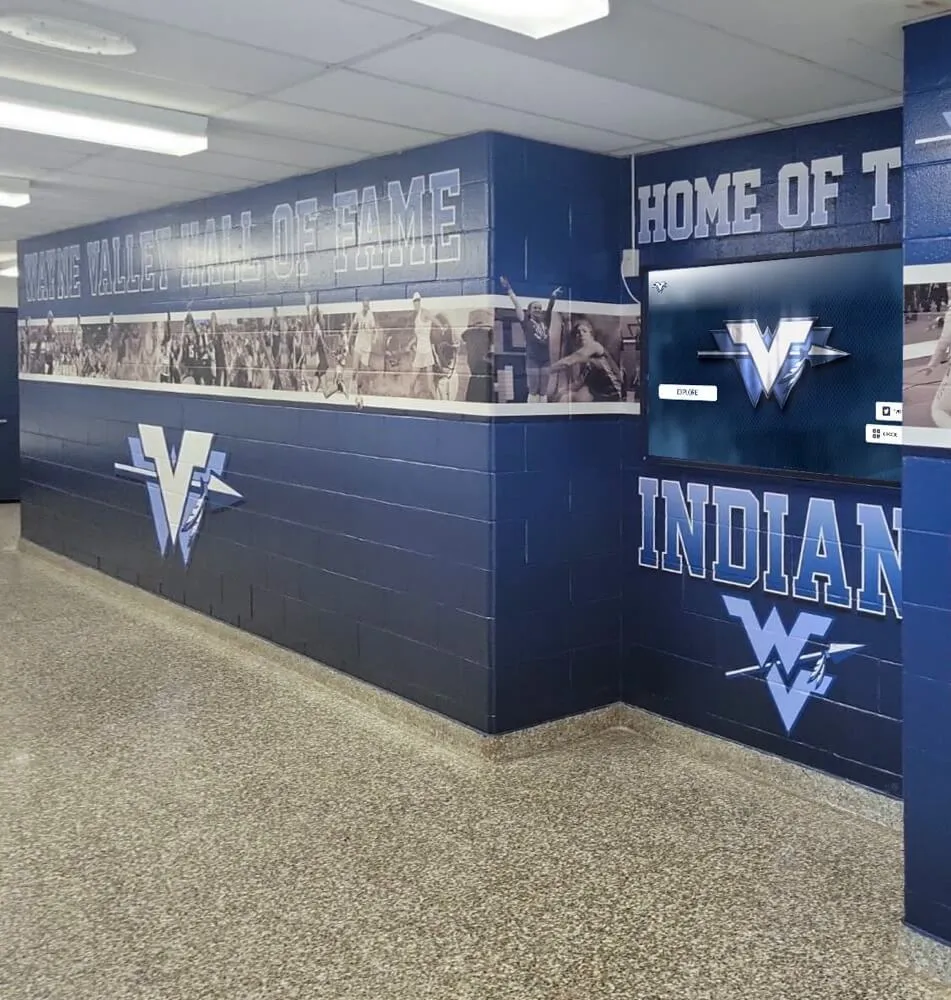
Interactive touchscreen displays invite visitor participation, transforming passive viewing into engaging exploration experiences
Program Snapshot: Interactive Digital Signage Implementation
Before exploring detailed strategies, understanding complete program scope helps organizations assess alignment with institutional goals and available resources.
| Program Element | Description | Key Considerations |
|---|---|---|
| Target Environments | School lobbies, museum galleries, corporate reception areas, community centers, athletic facilities, visitor centers | Different settings require content adapted to audience expectations and dwell time |
| Content Categories | Recognition programs, wayfinding assistance, historical archives, educational materials, event promotion, donor acknowledgment | Content diversity requires comprehensive platform capabilities |
| Primary Outcomes | Extended visitor engagement, self-service information access, recognition capacity expansion, operational efficiency, measurable impact | Success requires clear goals beyond “adding technology” |
| Technology Components | Commercial touchscreen displays, interactive content management platforms, network infrastructure, mounting systems, media servers | Purpose-built interactive systems outperform generic digital signage |
| Initial Investment | $12,000-$35,000 per location depending on screen size, features, and content complexity | Budget includes hardware, software, content development, installation, and training |
| Implementation Timeline | 10-20 weeks from planning through public launch for comprehensive installations | Rushed implementations with inadequate preparation consistently disappoint |
| Content Management | Cloud-based platforms with distributed contribution, scheduled updates, search optimization, analytics tracking | Sustainable operations require realistic staffing and clear responsibilities |
Understanding Interactive Digital Signage Engagement Advantages
Recognizing specific benefits interactive displays provide over passive broadcast signage helps build organizational support and guide strategic decision-making.
From Passive Viewing to Active Participation
Traditional digital signage inherits limitations from physical posters and bulletin boards:
The Broadcast Limitation
Static digital displays typically receive 2-8 seconds of attention as visitors glance while passing—similar to physical posters. Even well-designed content struggles to communicate complex information or comprehensive recognition within such brief exposure windows. This superficial engagement limits value delivery, reduces return on technology investment, and fails to capitalize on display capabilities beyond what physical signage accomplishes.
Interactive touchscreens fundamentally transform engagement depth. Research on visitor behavior consistently demonstrates that interactive displays generate 3-10 minutes of sustained engagement on average—representing 20-50 times longer interaction compared to passive signage. This dramatic difference occurs because interactivity enables visitors to pursue personal interests through self-directed exploration rather than consuming identical pre-determined messages regardless of individual relevance or curiosity.
According to digital engagement studies published in technology research journals, interactive exhibits create “flow states” where visitors become absorbed in discovery, losing awareness of time passage. Touchscreen features like search functionality, filtering options, image zooming, video playback, and related content suggestions maintain engagement by continuously offering new exploration pathways. Group interactions amplify impact as families, students, or colleagues discuss discoveries together, share findings, and explore collaboratively around displays accommodating multiple simultaneous users.
Organizations implementing comprehensive interactive touchscreen systems for cultural institutions report that extended engagement translates directly to improved information retention, higher satisfaction scores, increased return visits, and stronger word-of-mouth promotion.

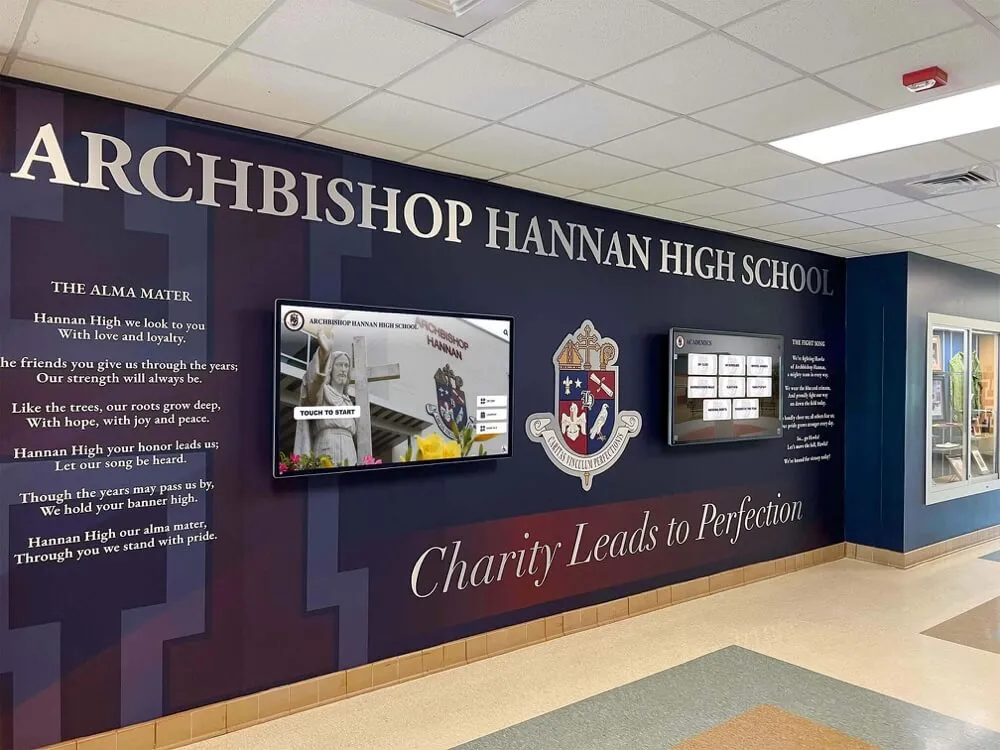
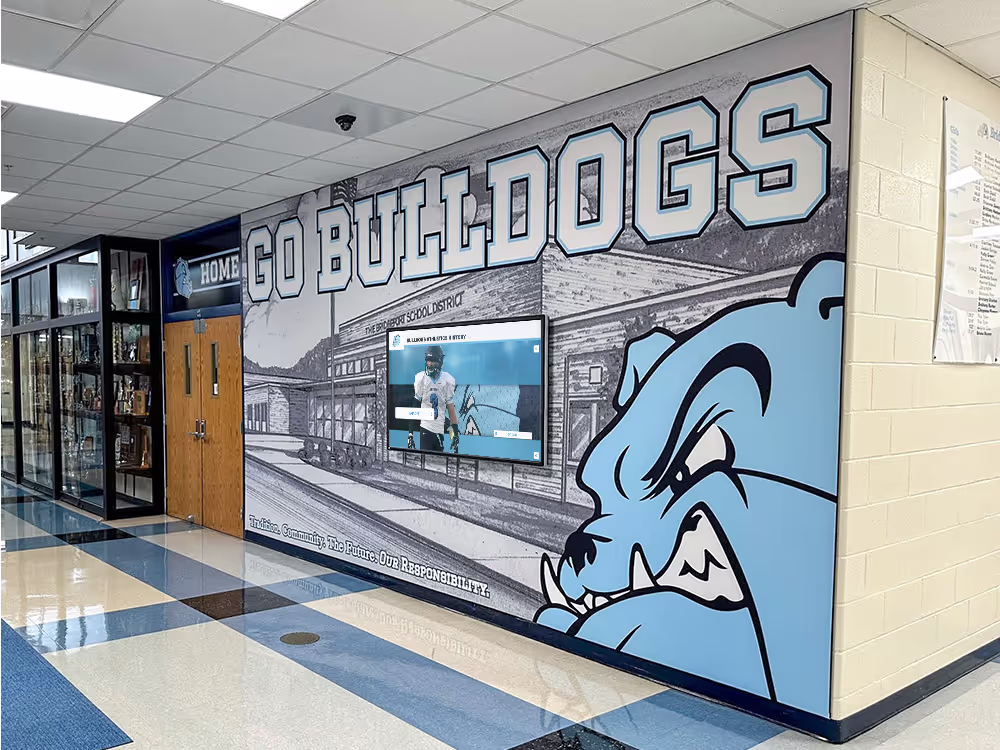
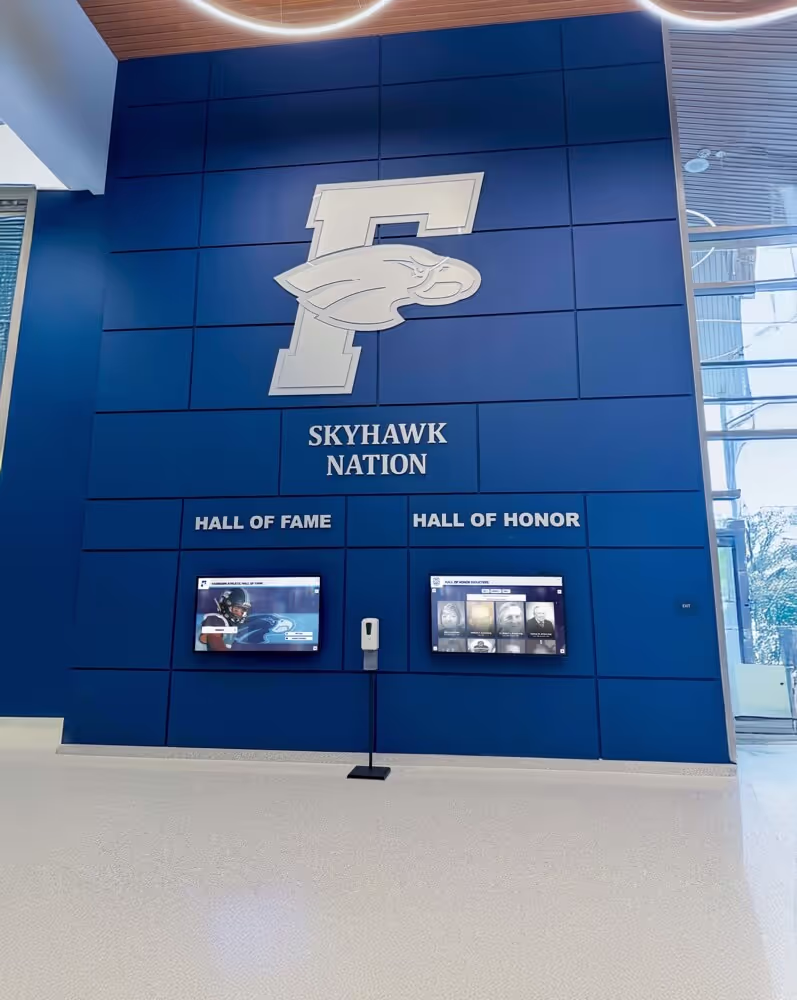
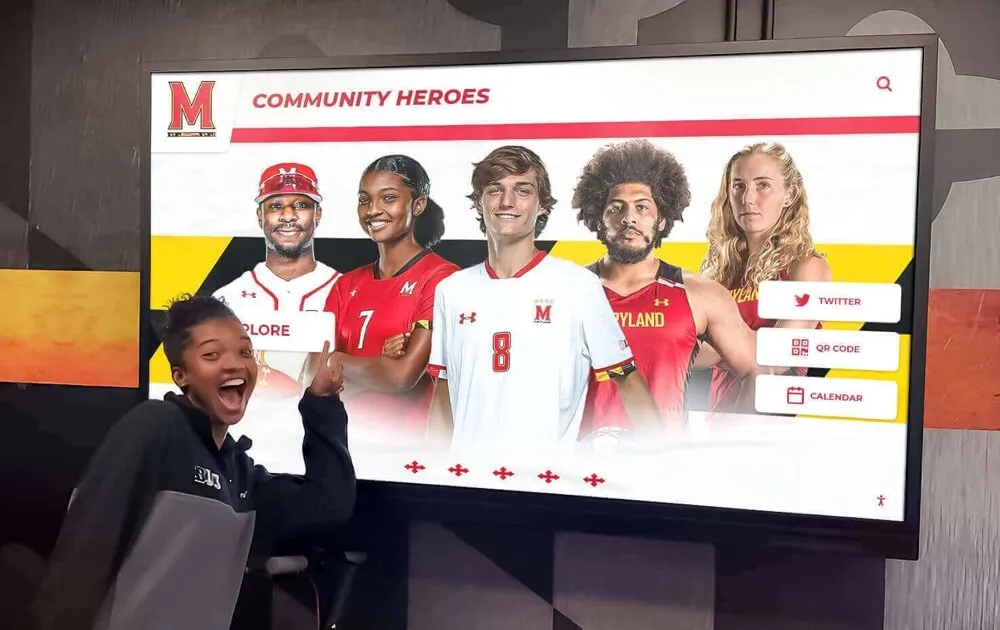
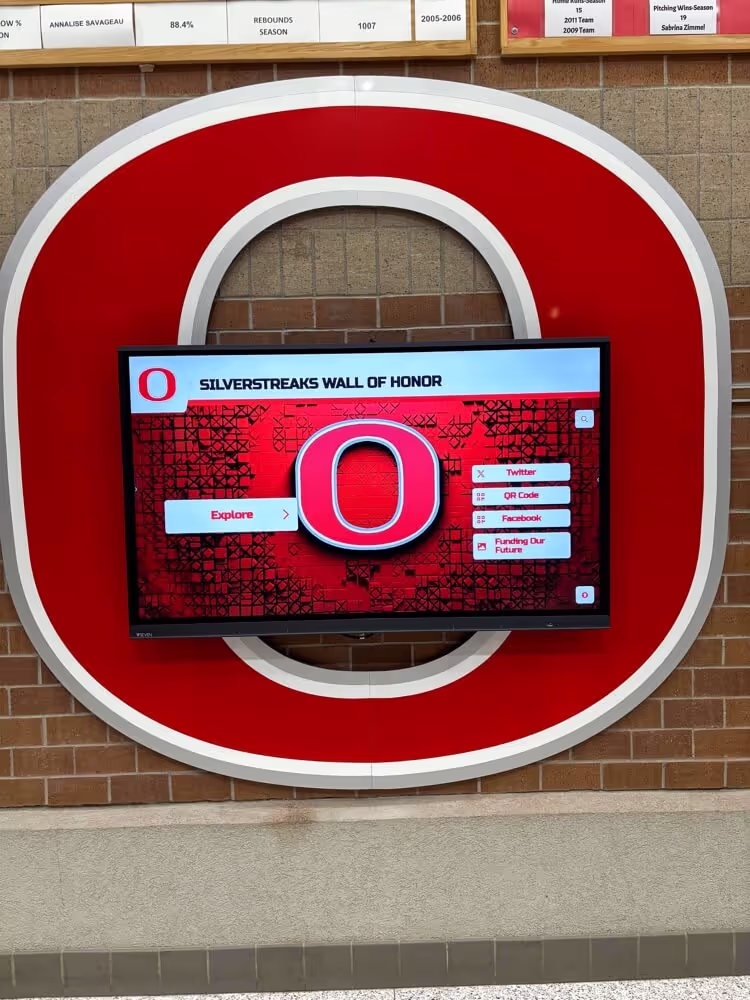
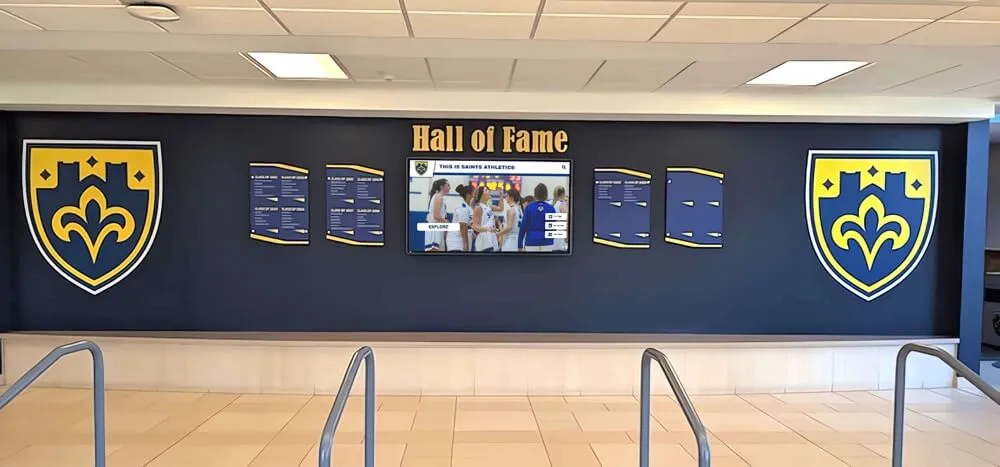
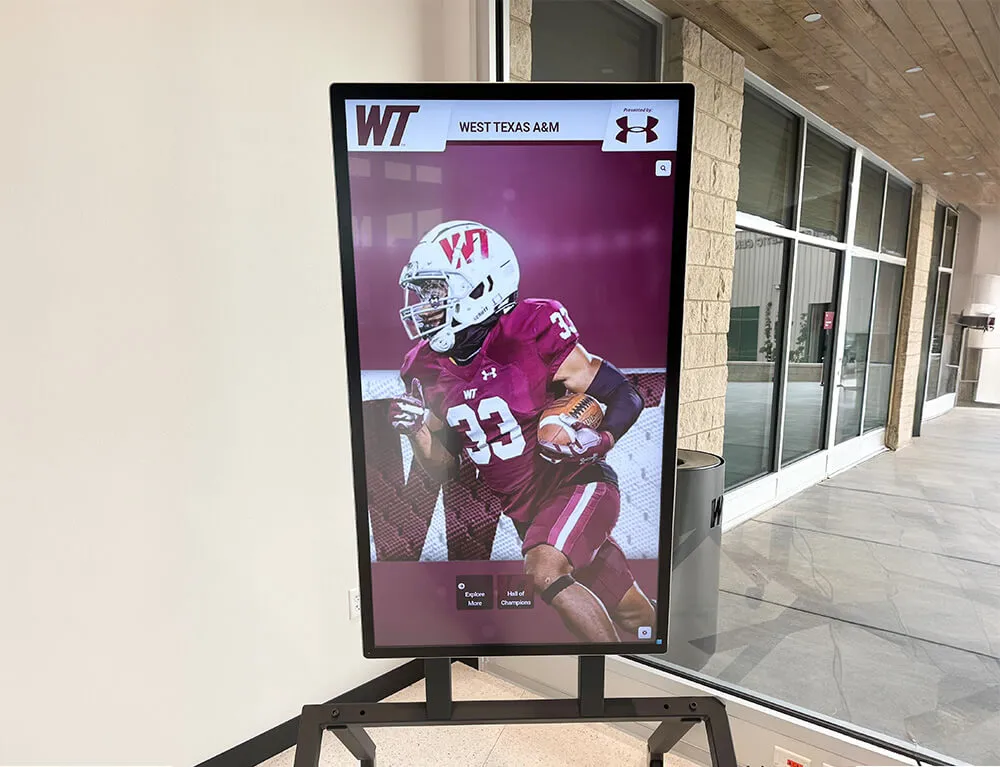
Intuitive touchscreen interfaces enable visitors of all technical abilities to explore content independently at their own pace
Self-Service Information Access Reducing Operational Burden
Reception desks, information centers, and administrative offices face repetitive inquiries requiring staff time for routine questions:
Common Information Requests
- Building wayfinding and room location queries
- Event schedules and program timing information
- Facility hours and service availability
- Historical background and organizational information
- Recognition listings and achievement archives
- Contact information for departments or individuals
- Visitor orientation and getting-started guidance
Staff members answering these questions repeatedly experience reduced productivity for higher-value responsibilities requiring human judgment and expertise. Organizations responding by creating extensive printed materials or static signage discover that visitors often overlook these resources or find them insufficient for specific needs.
Interactive digital signage enables comprehensive self-service information access:
Information Accessibility Features
- Powerful search functionality helping visitors locate specific details instantly
- Category browsing for users exploring rather than seeking particular information
- Detailed content depth providing comprehensive answers without staff intervention
- 24/7 availability serving visitors outside traditional office hours
- Multilingual support accommodating diverse visitor populations
- Accessibility features including text sizing and audio options
- Analytics revealing which information receives most requests
Schools implementing interactive touchscreen displays in high-traffic areas report 40-60% reductions in routine reception desk inquiries, enabling staff to focus on complex questions and visitor services requiring personal attention.
Unlimited Recognition Capacity Beyond Physical Constraints
Traditional recognition displays—trophy cases, plaques, printed honor rolls—face inherent space limitations determining how many individuals receive acknowledgment. Physical capacity constraints force difficult prioritization decisions about achievement thresholds, create ongoing maintenance challenges as displays age, and limit recognition to highest-achieving individuals while excluding broader participation acknowledgment.
Interactive digital signage eliminates these limitations completely:
Digital Recognition Advantages
- Unlimited profile capacity accommodating thousands of honorees without additional space
- Equal prominence providing all recognized individuals comparable presentation depth
- Rich multimedia content including photos, videos, statistics, and biographical narratives
- Search and filtering functionality helping visitors locate specific individuals instantly
- Regular updates enabling continuous additions without physical modifications
- Historical preservation documenting achievements across decades digitally
- Accessibility ensuring recognition reaches audiences beyond physical location visitors
Recognition programs transitioning from physical trophy cases to comprehensive digital displays typically celebrate 5-15 times more individuals while providing substantially richer content about each honoree compared to brief plaques offering only names and dates.
This expanded capacity proves particularly valuable for:
Athletic Recognition
- Complete season rosters for all teams across all sports and years
- Individual career statistics and performance records
- Championship team documentation with comprehensive participant lists
- Coach career achievements and program development contributions
- Multi-sport athlete recognition celebrating versatility
- Historical records showing program evolution across decades
Academic Excellence
- Honor roll displays updated each marking period indefinitely
- Valedictorian and salutatorian recognition across institutional history
- Scholarship recipients and award winners by category and year
- Academic competition results documenting intellectual achievement
- Perfect attendance and character awards celebrating consistency
- Alumni achievement spotlights connecting graduates to institution
Community Contribution
- Donor recognition organized by campaign and giving level
- Volunteer appreciation documenting service contributions
- Staff milestones celebrating professional achievements
- Historical figures who shaped organizational development
- Community partners supporting institutional mission
- Mentor program participants investing in development

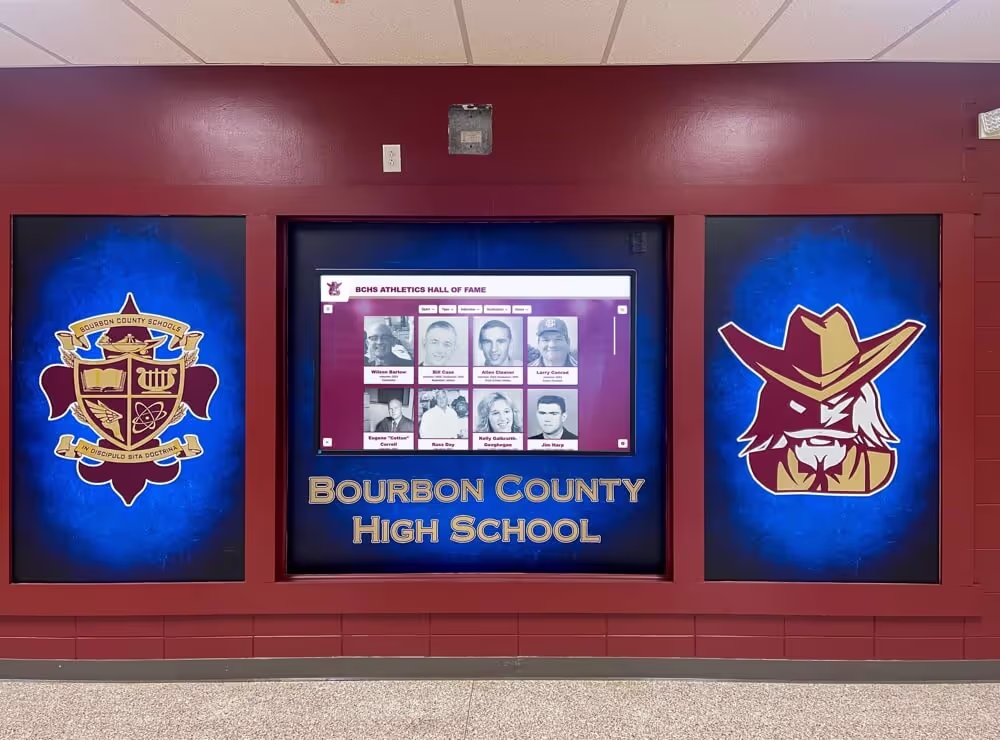
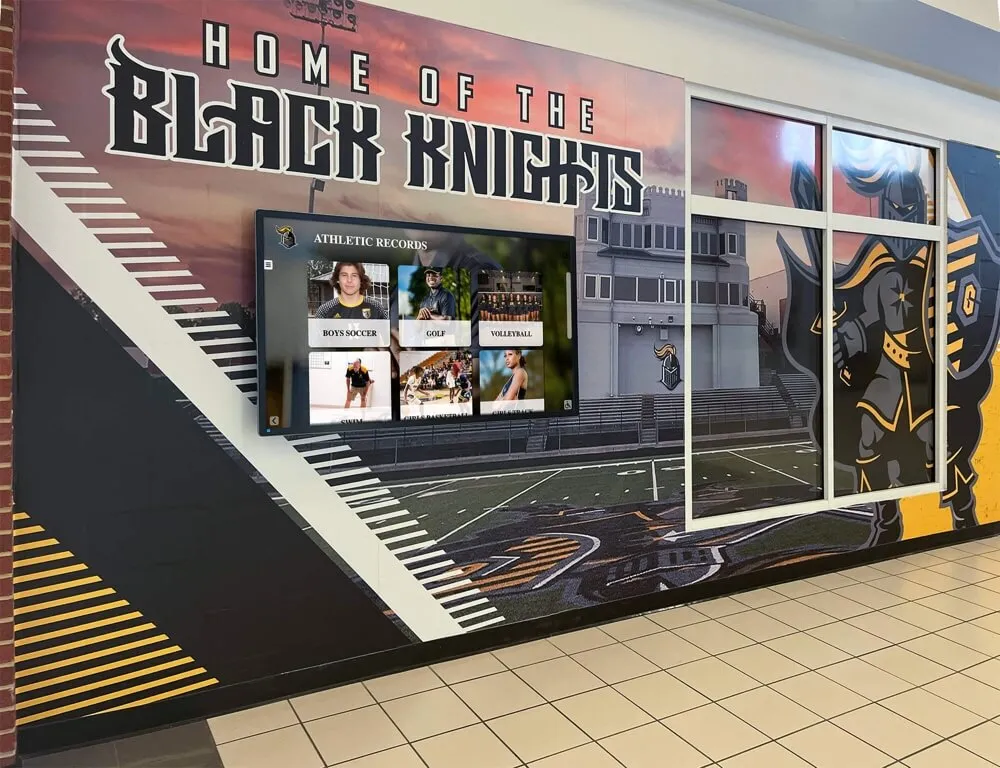
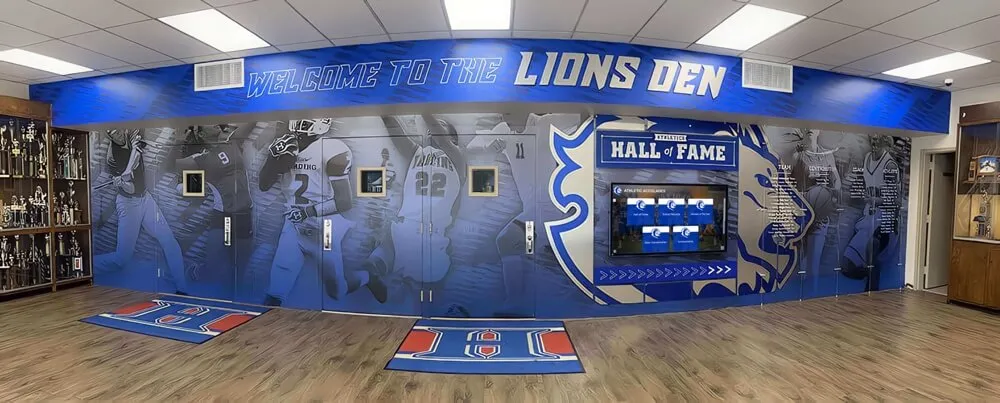
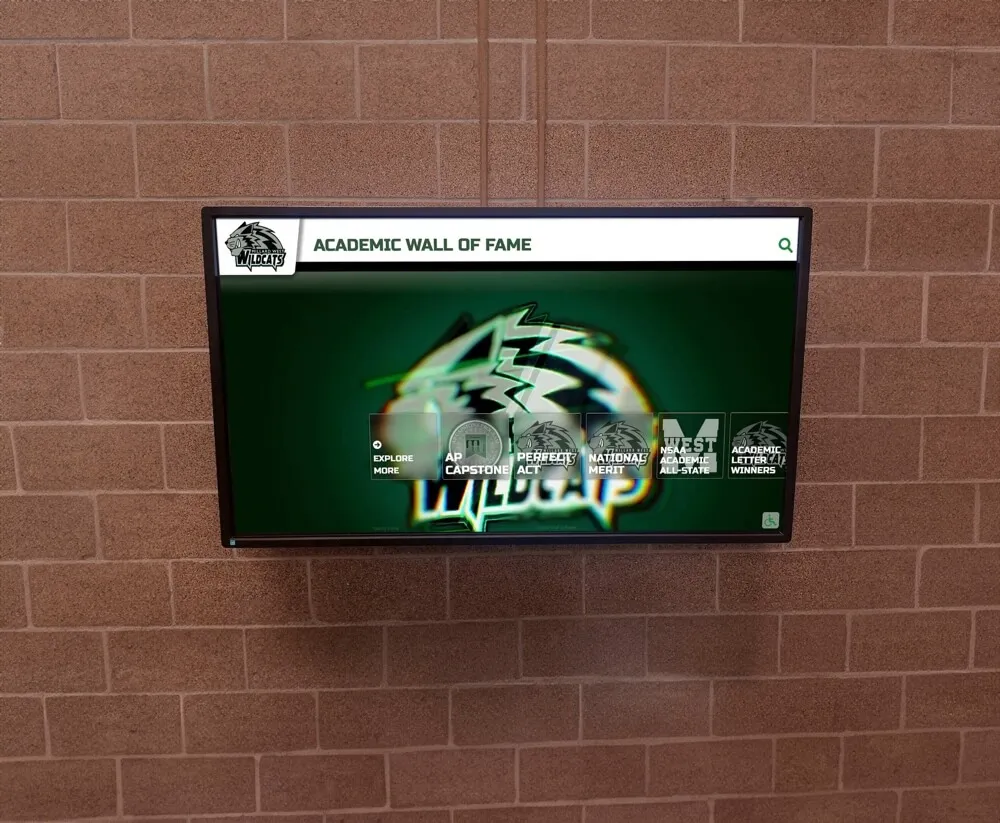
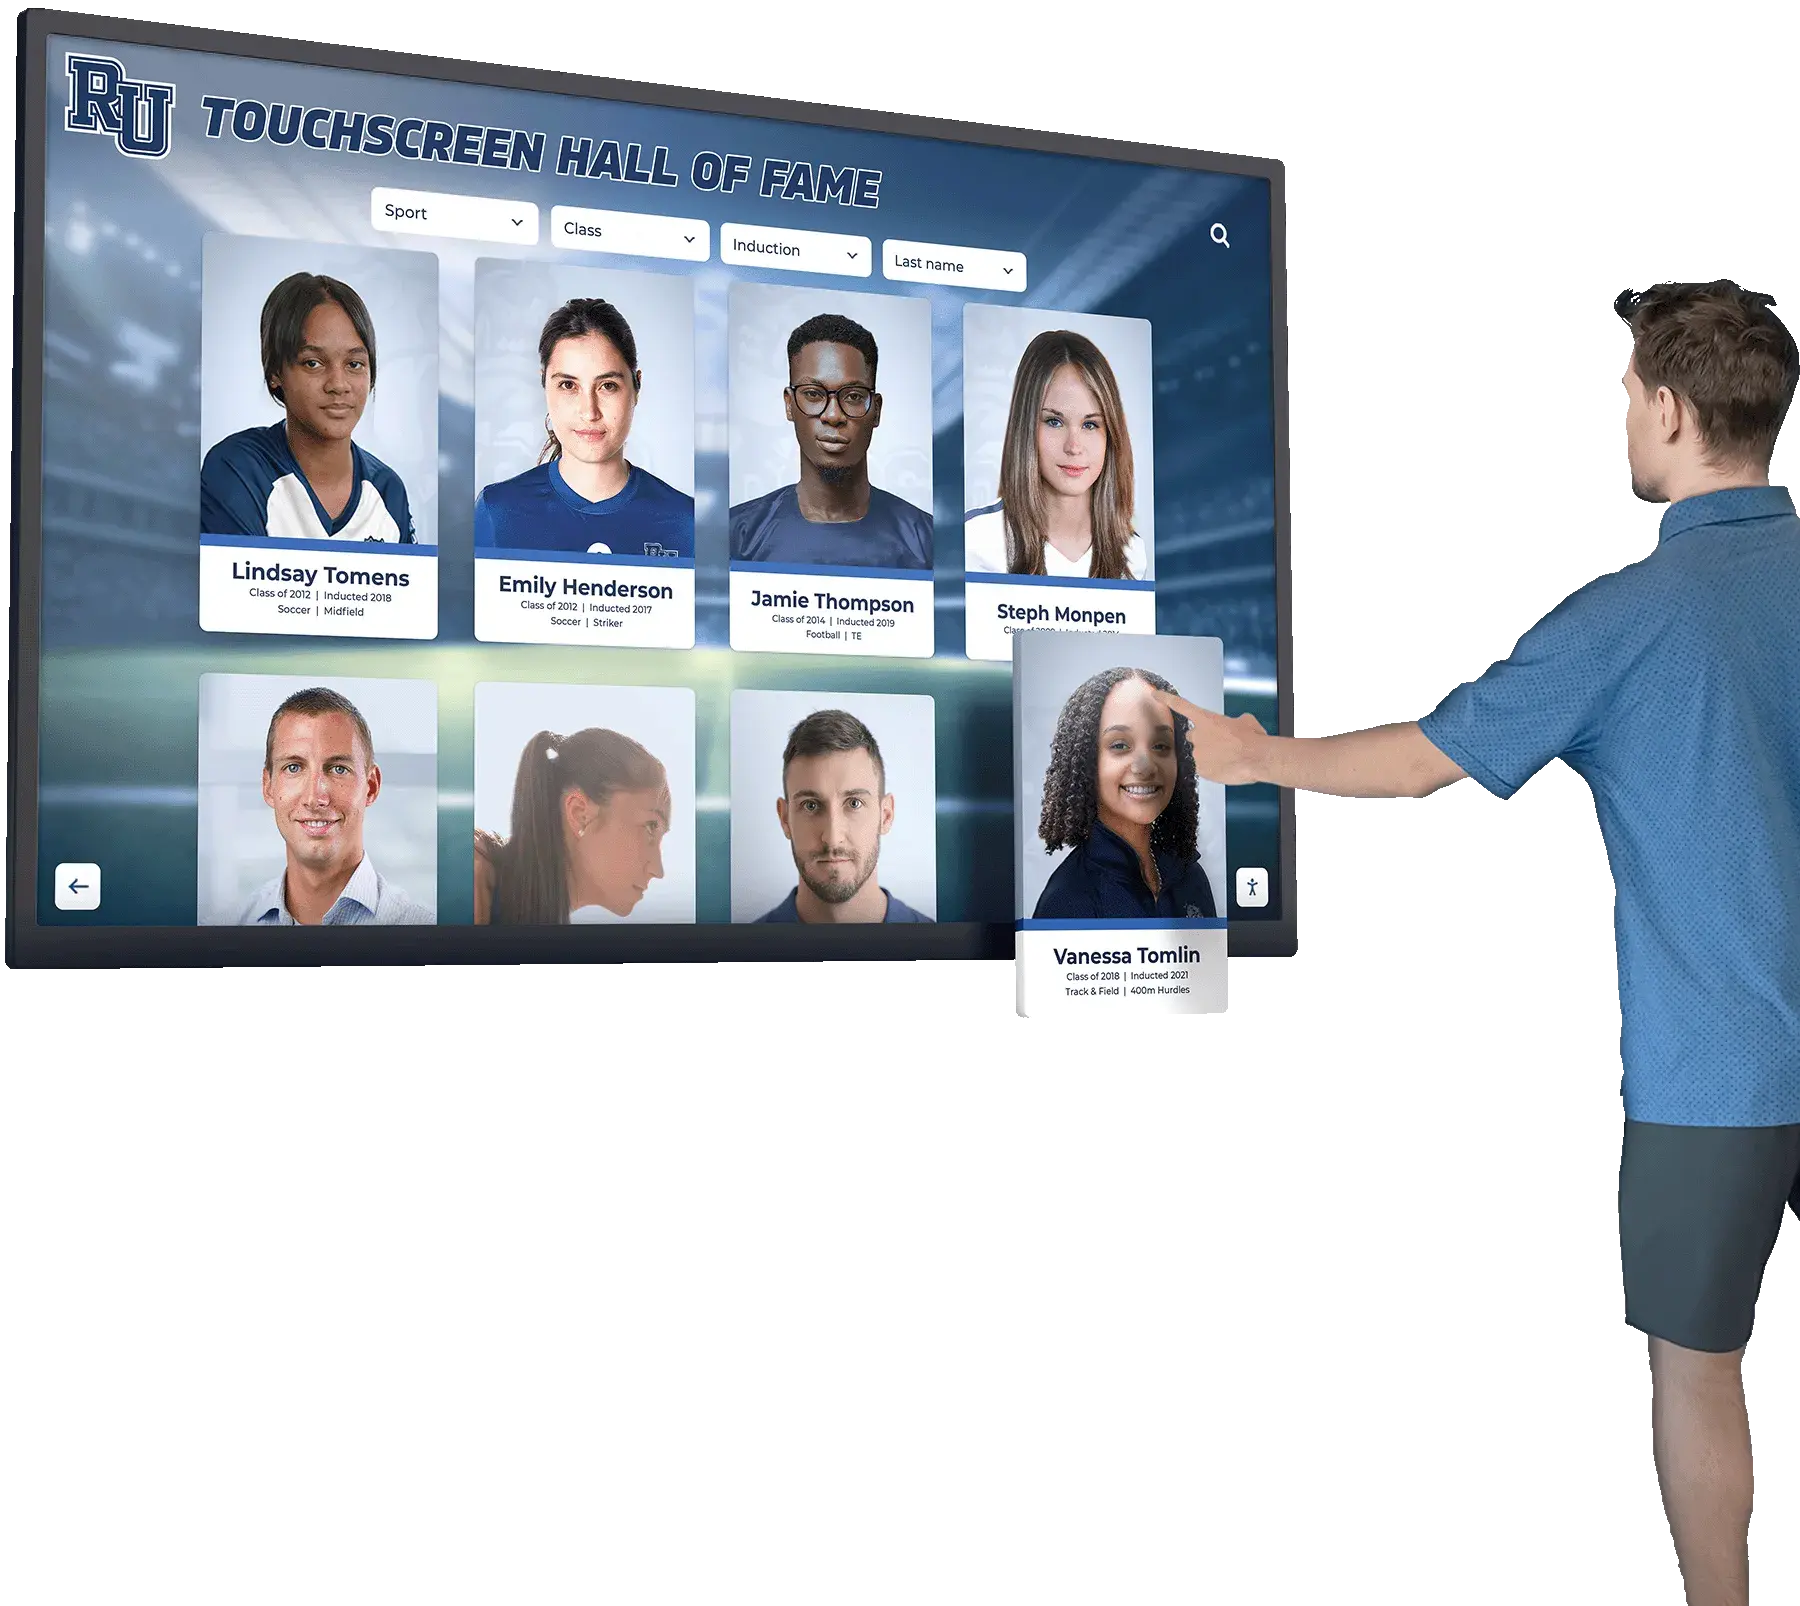
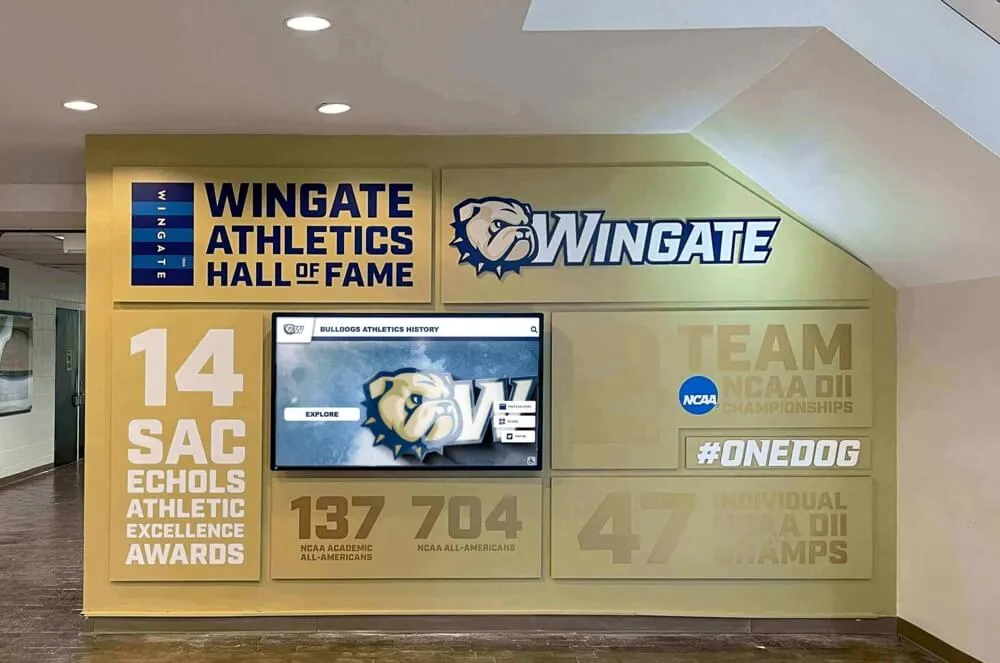
Digital recognition displays showcase unlimited individuals with rich profile content including photos, statistics, and achievements
Measurable Engagement Validating Technology Investment
Traditional signage provides no engagement metrics—organizations lack data about whether anyone actually views content, how long they engage, what information interests them, or which messages prove effective. This measurement gap prevents demonstrating return on investment, identifying improvement opportunities, or validating content strategy decisions.
Interactive digital signage generates comprehensive analytics:
Quantitative Engagement Metrics
- Total interactions showing how many visitors actively engage
- Session duration revealing depth of engagement versus brief touches
- Content popularity identifying most-explored materials
- Search query patterns exposing visitor interests and information needs
- Navigation pathways showing how users explore available content
- Feature utilization indicating which interactive elements receive use
- Peak usage times informing optimal scheduling and staffing
Behavioral Insights
- First-time versus return visitor patterns
- Group versus individual interaction differences
- Age-related usage pattern variations
- Seasonal engagement fluctuations
- Content gaps where visitors search unsuccessfully
- Technical challenges indicated by error patterns
- Conversion metrics tracking goal completions
Analytics dashboards transform assumptions into evidence while revealing continuous improvement opportunities. Organizations discover which content generates sustained engagement, identify information gaps requiring development, understand how visitors naturally navigate, and validate that technology investments deliver measurable value rather than representing expensive commitments generating uncertain impact.
Understanding approaches to digital signage services incorporating analytics helps organizations select platforms providing actionable measurement supporting ongoing refinement.
Content Architecture: Organizing Information for Interactive Discovery
Effective interactive displays organize diverse materials through structured frameworks specifically designed for exploration rather than broadcast consumption.
Intuitive Navigation Enabling Self-Directed Exploration
Visitors approaching interactive displays without prior instruction require immediately comprehensible navigation:
Homepage Design Principles
Effective launching points provide:
- Clear category tiles with descriptive labels and representative imagery
- Search bars prominently positioned for goal-oriented users
- Featured content highlights as exploration entry points
- Visual hierarchy guiding attention to primary pathways
- Minimal text relying on imagery and intuitive organization
- Consistent branding establishing institutional identity
- Touch-friendly target sizing accommodating all users
Multi-Level Information Organization
Comprehensive content requires hierarchical structures:
- Top-level categories organizing content into intuitive groupings (Athletics, Academics, History, Community)
- Subcategories enabling refined browsing (Athletics → Football, Basketball, Track; History → Timeline, Photo Archive, Notable Figures)
- Individual profiles providing detailed information about specific people, events, or achievements
- Related content suggestions facilitating continued exploration across categories
- Breadcrumb navigation helping users understand location within content hierarchy and backtrack easily
Search and Filter Functionality
Discovery tools accommodate various exploration approaches:
- Full-text search across all content finding keywords anywhere in profiles
- Auto-complete suggestions preventing spelling errors and accelerating discovery
- Advanced filtering by multiple criteria simultaneously (year + sport + achievement type)
- Sort options organizing results by relevance, date, name, or popularity
- Saved searches enabling return visitors to quickly access previous discoveries
Schools and museums implementing interactive museum displays discover that intuitive navigation proves essential—even compelling content fails to engage when users struggle to locate it or understand how to explore available materials.

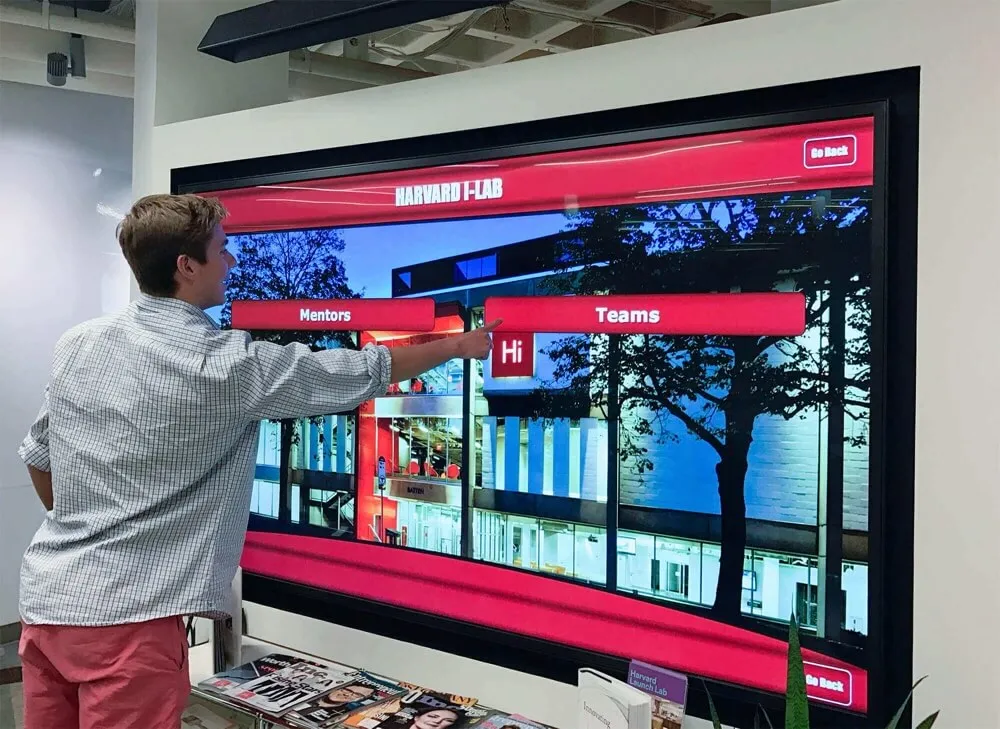
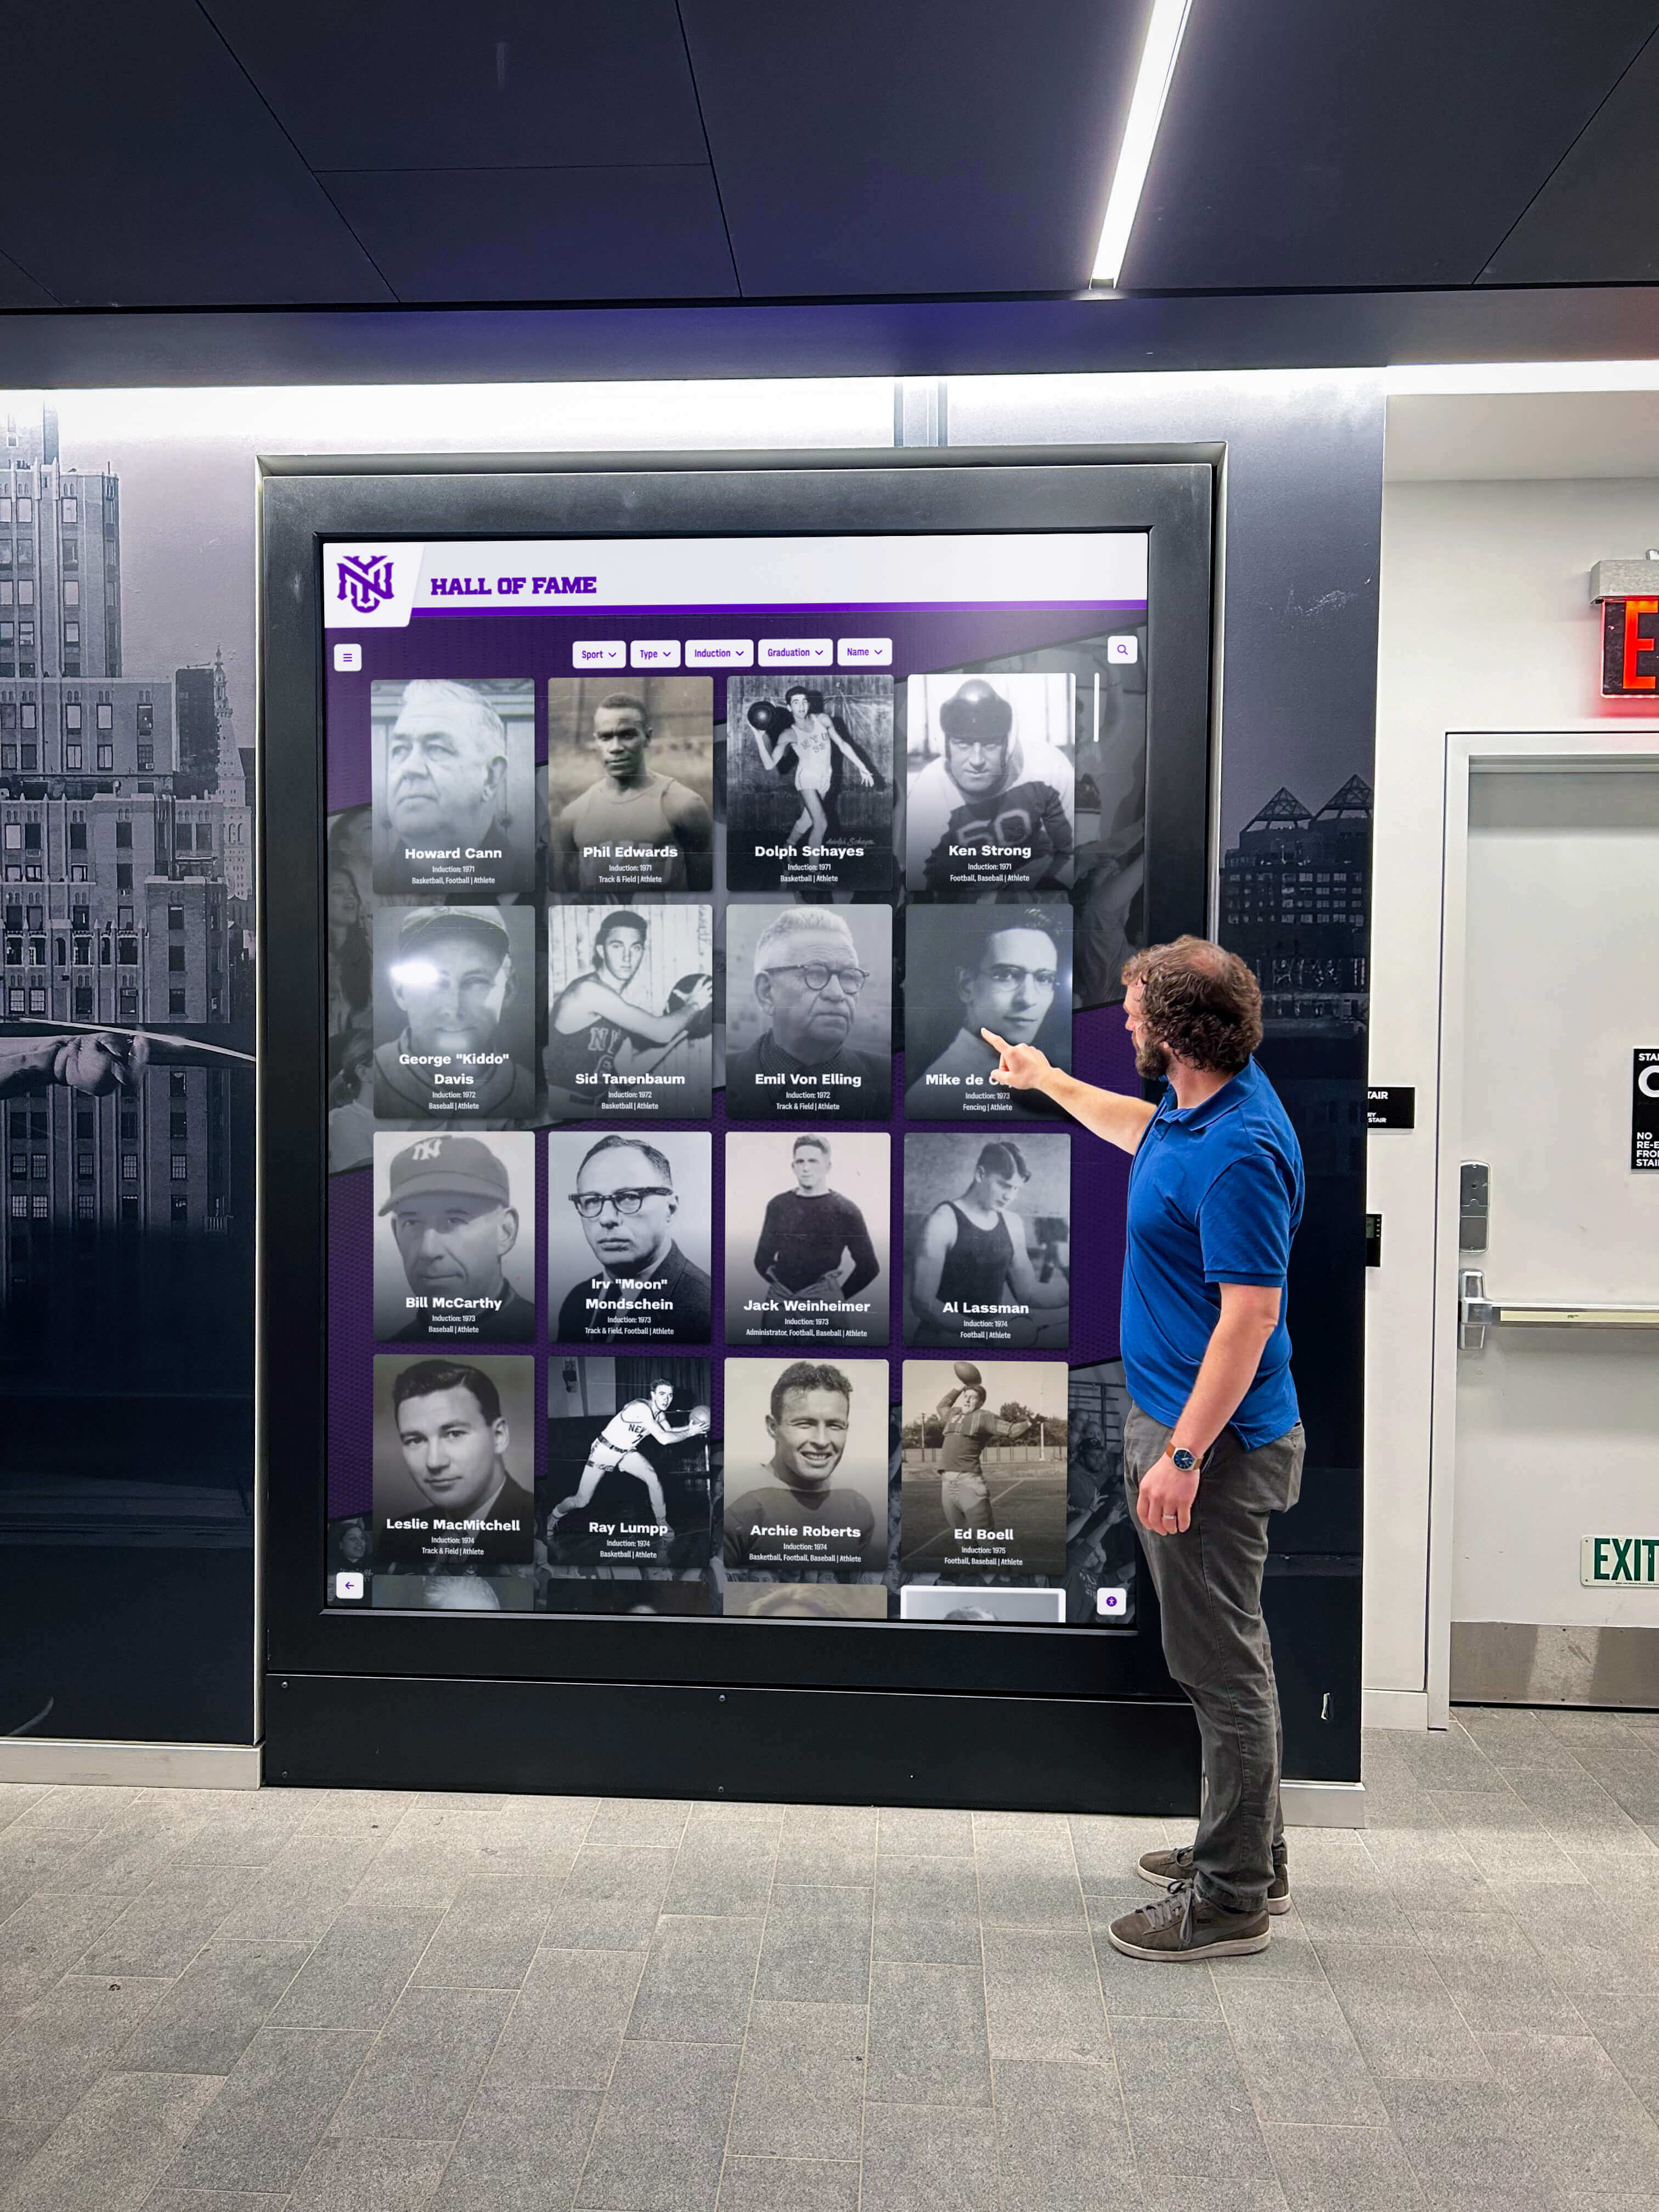
Well-designed interfaces guide visitors through content exploration without requiring instruction or technical expertise
Content Depth Rewarding Extended Engagement
Surface-level information fails to sustain multi-minute interactions—comprehensive content depth proves essential for capitalizing on interactivity advantages:
Individual Profile Completeness
Recognition content should provide:
- High-resolution photography showing individuals clearly
- Biographical narratives explaining backgrounds and contributions
- Comprehensive achievement documentation with specific details
- Career statistics or performance records where relevant
- Video content including highlights, interviews, or demonstrations
- Historical context connecting individuals to broader institutional story
- Related profile links revealing connections and relationships
- Social sharing options enabling personal promotion
Multimedia Integration
Rich media creates engaging experiences impossible with text alone:
- Photo galleries documenting events, seasons, or careers comprehensively
- Video highlights bringing athletic performances and artistic achievements to life
- Audio recordings including interviews, oral histories, or musical performances
- Interactive timelines showing chronological development with engaging visuals
- Document archives providing access to historical materials digitally preserved
- 3D imagery enabling examination from multiple angles when appropriate
Historical Archives and Timelines
Institutional heritage content strengthens community connections:
- Chronological presentations showing evolution across decades or centuries
- Milestone documentation highlighting significant achievements and transitions
- Photo archives preserving visual history digitally accessible
- Tradition explanations helping newcomers understand established practices
- Facility evolution documenting campus or building development
- Leadership recognition honoring administrators and coaches who shaped organizations
Organizations developing comprehensive heritage content benefit from understanding school historical timeline display strategies that engage contemporary audiences while preserving institutional memory.
Regular Content Updates Maintaining Freshness
Static content becomes stale quickly—visitors who explored thoroughly during initial encounters lack motivation to return without new materials:
Content Update Strategies
Sustainable programs implement:
- Seasonal rotations featuring content relevant to current activities
- Event-driven additions documenting recent programs and achievements immediately
- Periodic recognition cycles adding honor roll recipients, scholarship winners, or award honorees systematically
- Historical content development filling archives gradually as materials become available
- Featured content highlights changing homepage promotions regularly
- Anniversary commemorations celebrating milestones and historical connections
- Community contributions accepting submissions expanding content collaboratively
Distributed Content Creation Models
Centralized management creates bottlenecks—effective programs distribute responsibility:
- Role-based access enabling appropriate staff to contribute within their domains
- Submission portals collecting information from coaches, teachers, or community members
- Approval workflows ensuring content review before publication when appropriate
- Template standardization maintaining consistent quality across contributors
- Calendar integration automating event and schedule information
- Social media feeds displaying curated content from institutional accounts
- User-friendly interfaces supporting non-technical contributors effectively
Cloud-based content management systems enable distributed contribution while maintaining administrative oversight. Athletic directors add game results, counselors submit scholarship recipients, historical society members contribute archival materials, and communications staff coordinate overall programming—all through intuitive interfaces requiring no technical expertise.

Regular content updates featuring recent achievements maintain visitor engagement and encourage return interactions
Display Integration: Strategic Placement for Maximum Engagement
Physical location determines interactive display success as dramatically as content quality and interface design.
High-Traffic Common Areas Where Visitors Congregate
Primary installations target locations where people naturally gather with discretionary time:
Building Lobbies and Reception Areas
Entrance spaces serve multiple audiences:
- First impression creation setting expectations for visitor experiences
- Wayfinding assistance helping guests locate destinations independently
- Organizational introduction educating visitors about mission and programs
- Recognition visibility showcasing achievements to all facility users
- Dwell time availability as visitors wait for appointments or meetings
- Peak traffic concentration during arrival and departure periods
Lobby displays should feature:
- Large format screens (55-75 inches) commanding visual attention
- Prominent placement ensuring visibility from entry points
- Attractive surrounds integrating with architectural aesthetics
- Seating proximity encouraging extended exploration
- ADA-compliant mounting ensuring accessibility
- Network reliability supporting uninterrupted operation
Cafeterias and Social Gathering Spaces
Community areas offer unique engagement opportunities:
- Extended dwell time during meals providing sustained interaction potential
- Social context where visitors discuss content with companions
- Relaxed environment conducive to exploration rather than rushed navigation
- Diverse audiences including regular users and occasional visitors
- Peer visibility as others observe engagement modeling appropriate use
Cafeteria and commons installations benefit from:
- Student-focused content emphasizing peer recognition and upcoming events
- Interactive elements encouraging group exploration and discussion
- Volume consideration for video content in potentially noisy environments
- Durable construction withstanding intensive daily use
- Multiple displays accommodating simultaneous users when space permits
Athletic and Performing Arts Facilities
Specialized spaces create targeted engagement:
- Athlete and performer immersion during practices, rehearsals, and events
- Family audiences attending competitions, games, and performances
- Alumni connection through comprehensive historical documentation
- Recruitment support for prospective students and families evaluating programs
Facilities implementing gym lobby touchscreen displays report highest engagement when featuring sport-specific content during relevant seasons while maintaining year-round comprehensive recognition.

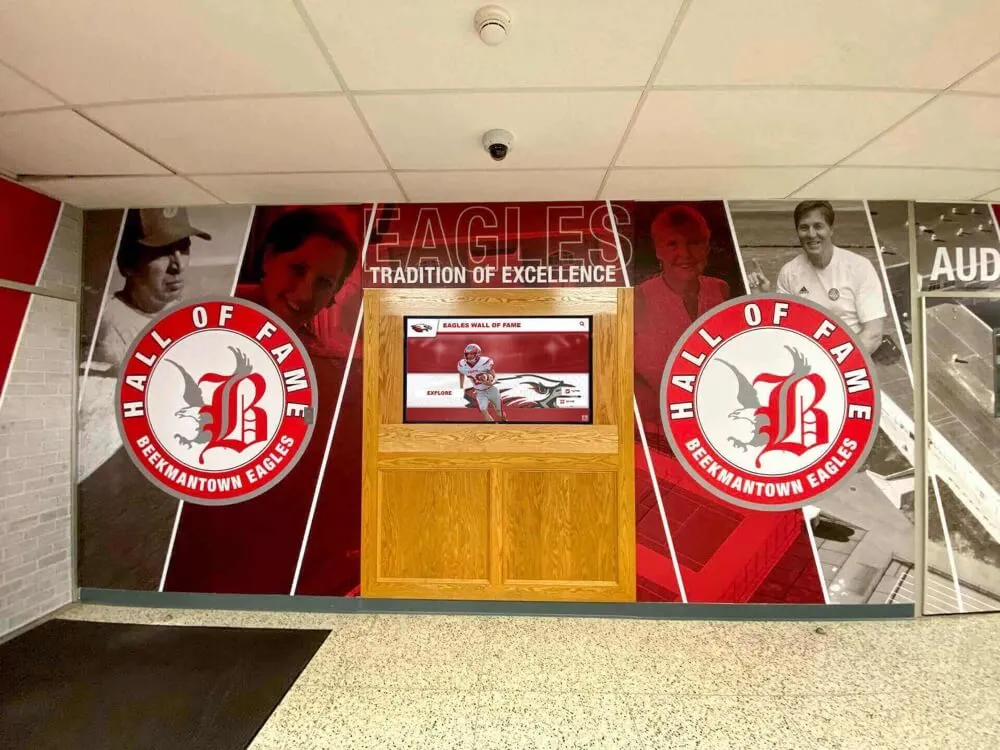
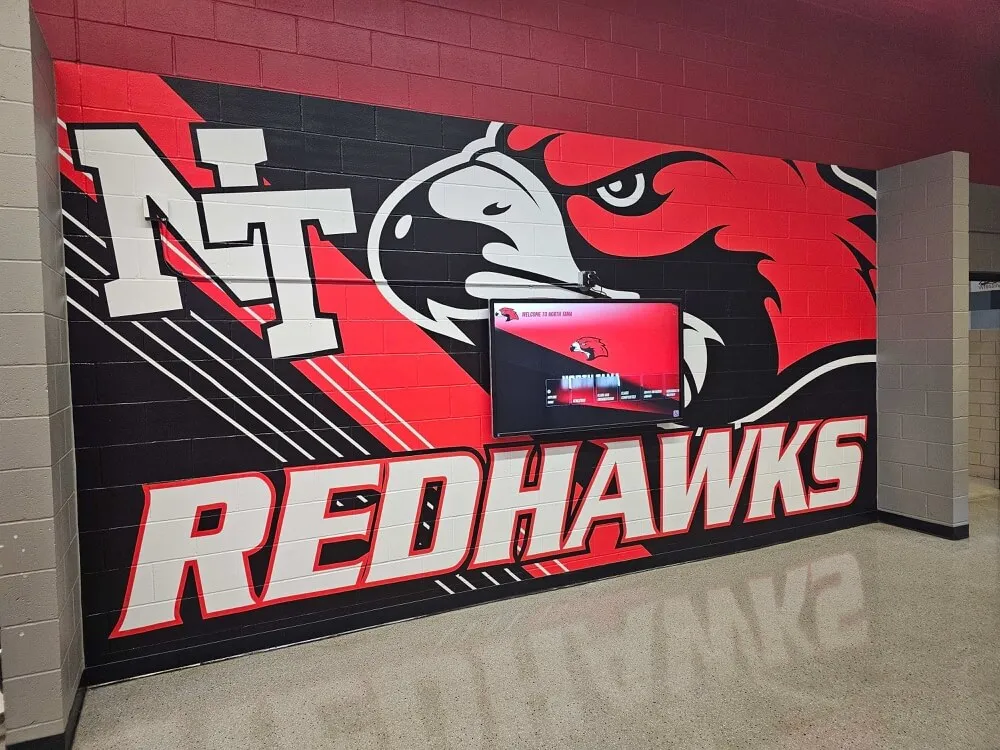
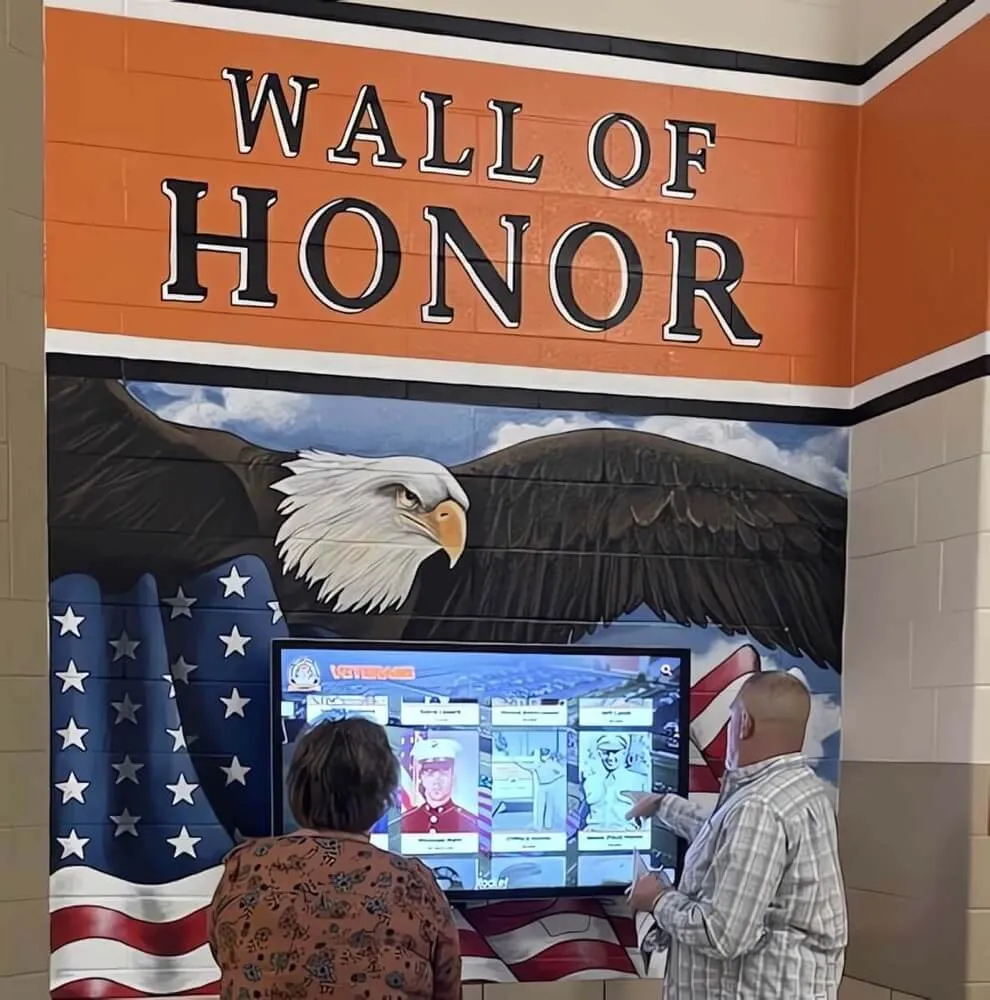
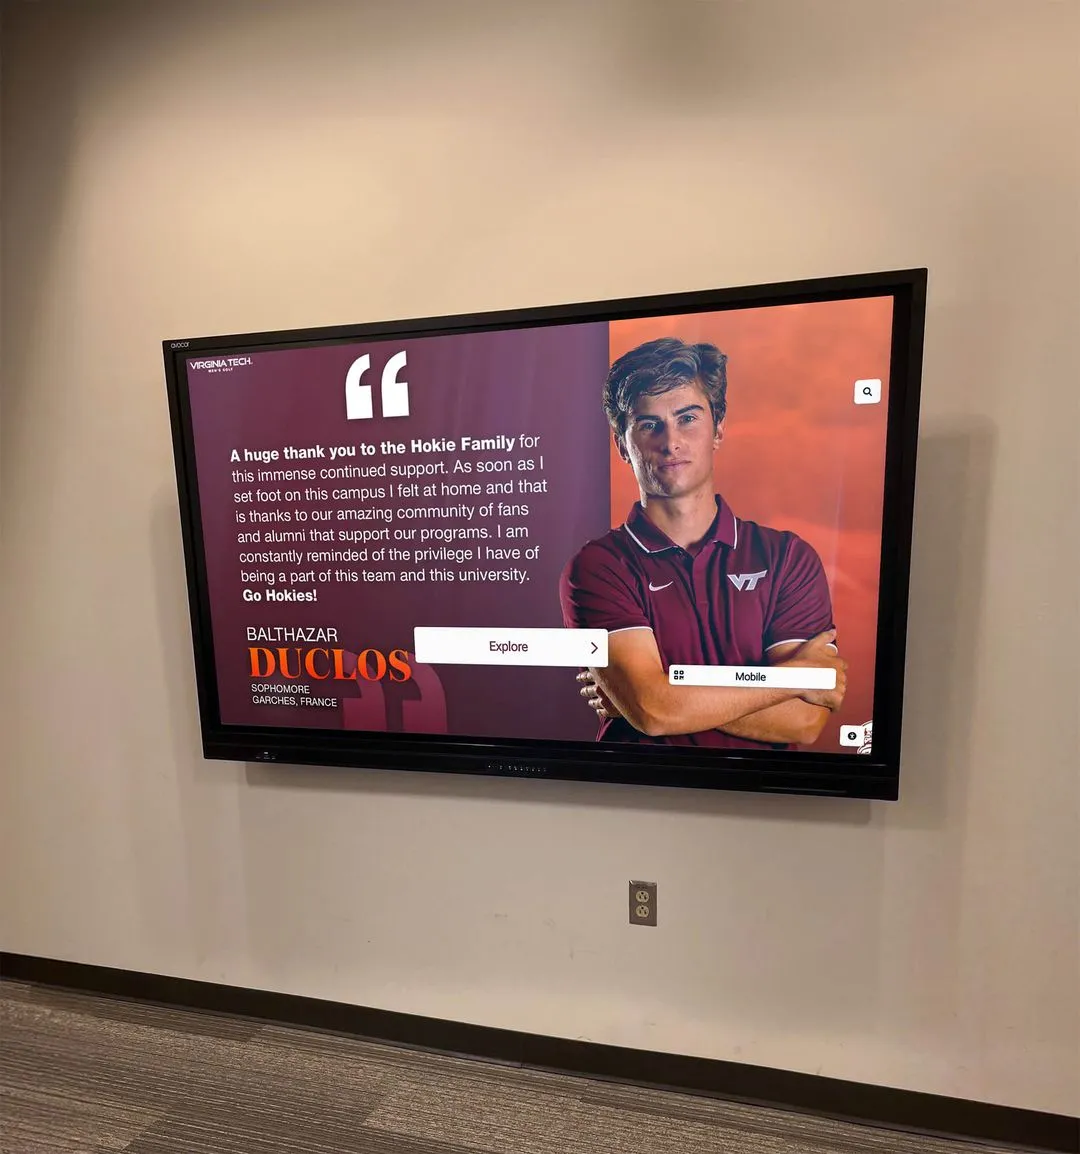
Athletic facilities provide ideal locations for recognition displays serving athletes, families, and visitors regularly
Specialized Functional Locations Serving Specific Purposes
Beyond general engagement, targeted placements address particular use cases:
Wayfinding and Visitor Services
Navigation assistance locations require:
- Building directories helping visitors locate specific rooms or departments
- Interactive maps for larger facilities with complex layouts
- Event information directing guests to current activities
- Parking guidance coordinating arrival logistics
- Accessibility information about elevators, ramps, and facilities
- Emergency procedures displayed prominently for safety
Educational and Museum Settings
Learning environments benefit from:
- Exhibit complementing providing deeper context for physical displays
- Collection access showcasing materials from storage beyond visible galleries
- Research support enabling scholarly inquiry and detailed examination
- Educational programming aligned with curriculum standards for school groups
- Behind-the-scenes content revealing conservation and research processes
Museums and cultural institutions benefit from understanding museum-specific interactive display approaches designed for visitor education and engagement.
Donor Recognition and Advancement
Development-focused installations feature:
- Comprehensive donor directories organized by campaign and giving level
- Impact visualization showing how contributions enable programs
- Historical giving patterns demonstrating sustained philanthropic support
- Naming opportunity information for prospective major donors
- Stewardship messaging expressing appreciation appropriately
- Campaign progress building momentum toward fundraising goals
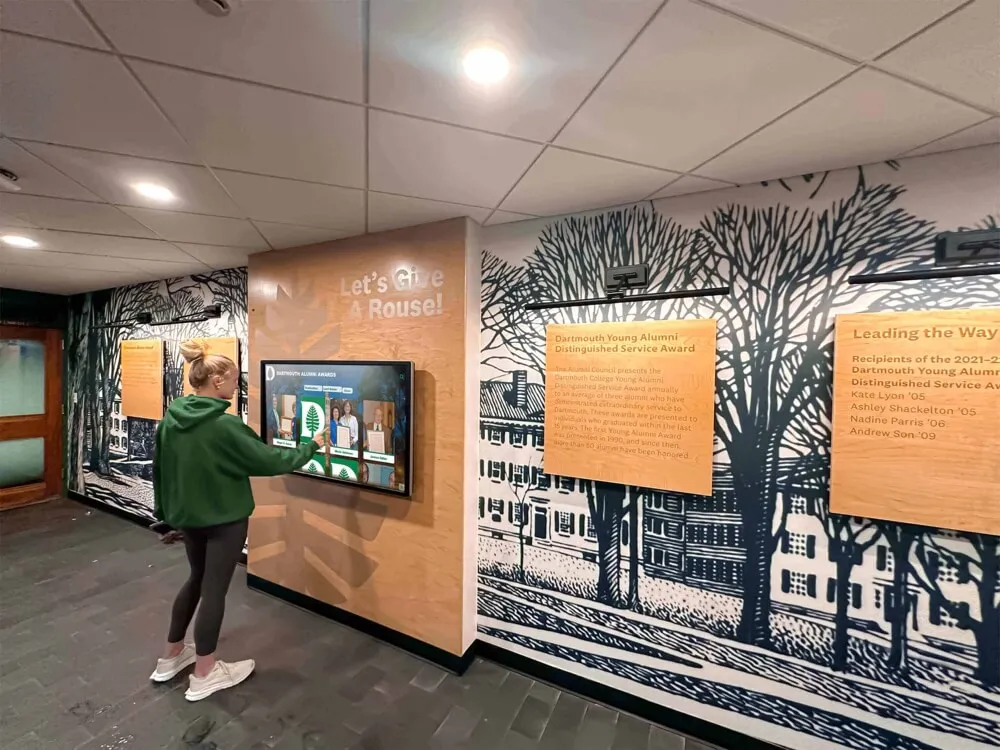
Organizations implementing donor recognition displays discover that thoughtful presentation strengthens relationships while inspiring additional support.
Technical Infrastructure Supporting Reliable Operation
Location selection requires infrastructure assessment:
Network Connectivity Requirements
- Adequate bandwidth supporting multimedia content delivery
- Network security protecting systems from unauthorized access
- Wired connections for mission-critical applications requiring reliability
- Wireless options for flexible placement when appropriate
- Remote monitoring enabling proactive technical support
- Redundancy planning ensuring backup connectivity
Environmental Considerations
- Ambient lighting assessment ensuring screen visibility
- Temperature control preventing overheating
- Physical security deterring vandalism or theft
- Ventilation providing adequate airflow for equipment
- Power availability with appropriate electrical capacity
- Maintenance accessibility for technical servicing
ADA Compliance and Accessibility
- Mounting height enabling wheelchair user operation
- Clear floor space accommodating mobility device approach
- Touch target sizing supporting users with limited dexterity
- Audio alternatives for visual content
- High-contrast modes supporting low vision users
- Screen reader compatibility where applicable
Professional installation by qualified integrators ensures displays integrate seamlessly with facilities while meeting all regulatory requirements and technical specifications.

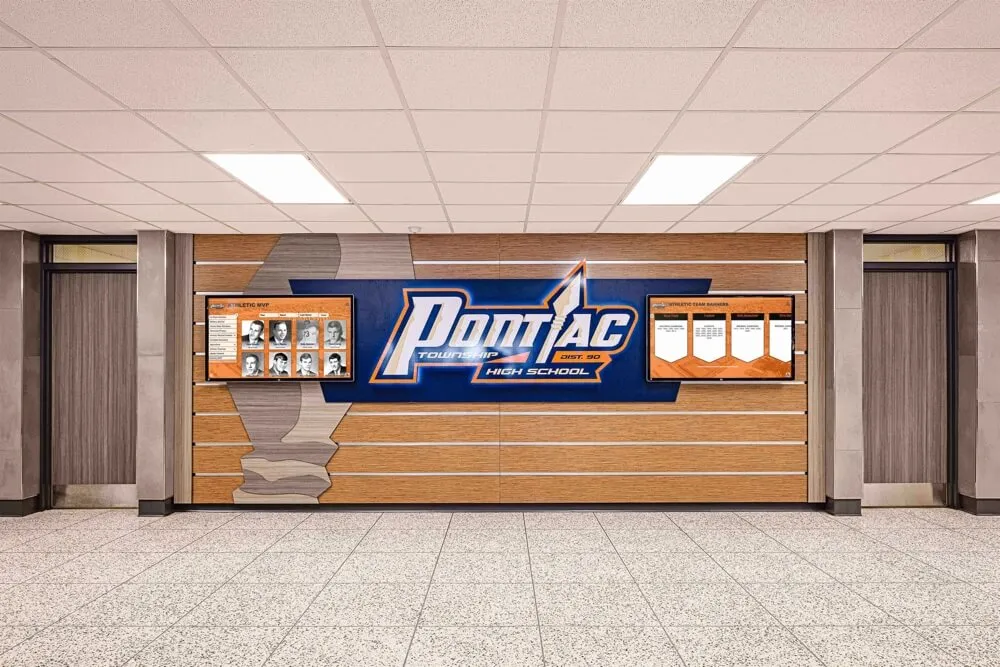
Professional installation integrates displays attractively with existing facility elements and architectural features
Execution Timeline: Implementing Interactive Signage Programs Step-by-Step
Successful deployments follow systematic phases ensuring professional execution and community adoption.
Phase 1: Planning and Needs Assessment (Weeks 1-4)
Initial planning establishes program foundations:
Stakeholder Engagement and Goal Definition
- Form implementation committee representing diverse organizational perspectives
- Conduct stakeholder interviews understanding communication needs and priorities
- Define primary use cases determining emphasis (recognition, wayfinding, education, communication)
- Establish success metrics measuring program effectiveness
- Identify target audiences and their specific information needs
- Secure administrative approval and budget authorization
- Develop project charter documenting scope, timeline, and responsibilities
Technology Research and Vendor Evaluation
- Distinguish purpose-built interactive platforms from generic digital signage
- Evaluate cloud-based versus on-premise hosting options
- Compare total cost of ownership including hardware, software, support, and content services
- Review vendor experience with comparable organizations
- Request customer references and conduct site visits
- Assess platform capabilities including content management, search, analytics, and accessibility
- Negotiate pricing and contract terms
Site Assessment and Placement Planning
- Survey potential display locations throughout facilities
- Analyze visitor traffic patterns and dwell time availability
- Evaluate network infrastructure and connectivity adequacy
- Assess environmental conditions affecting display performance
- Verify electrical capacity and power availability
- Consider sightlines and physical accessibility
- Plan for multiple installations creating distributed access
Thorough planning prevents expensive course corrections, hardware relocations, or software changes after poor initial implementations generate negative first impressions.
Phase 2: Content Development and Media Production (Weeks 4-12)
Launch content quality determines first impression success:
Historical Content Development
Comprehensive launch libraries include:
- Recognition profiles for 50-200+ individuals depending on institutional history
- Photo archives with 200-500+ historical images properly catalogued
- Video content including 10-20 highlight reels or interviews
- Historical timeline content spanning decades or longer
- Faculty/staff profiles highlighting credentials and contributions
- Organizational history narratives explaining heritage and mission
- Achievement documentation across multiple years and programs
Organizations launching with sparse content disappoint communities—comprehensive initial development creates positive impressions enabling successful program establishment.
Media Production and Digitization
- Professional photography of recent honorees and current programs
- Historical photo scanning at appropriate resolutions
- Video editing creating polished highlight packages
- Audio recording for interviews or oral histories
- Document digitization preserving historical materials
- Graphic design creating visual consistency
- Quality control ensuring accuracy and presentation standards
Metadata Development and Search Optimization
- Standardized data fields enabling filtering and organization
- Descriptive content writing at appropriate reading levels
- Keyword optimization supporting comprehensive search
- Category assignment for intuitive browsing
- Cross-referencing related profiles and content
- Accessibility text including image descriptions
- Source documentation and permissions tracking
Understanding approaches to wall of fame ideas and recognition strategies helps organizations develop compelling content celebrating diverse achievements.

Comprehensive content development creates rich, searchable databases rewarding extended visitor exploration
Phase 3: Hardware Installation and Software Configuration (Weeks 10-16)
Professional deployment ensures quality results:
Physical Installation
- Commercial display mounting by certified integrators
- Network connectivity configuration and testing
- Power supply installation and verification
- Cable management creating professional appearance
- Protective measures preventing accidental damage
- ADA compliance verification
- Environmental testing confirming proper operation
Software Platform Configuration
- Content platform setup including branding and design
- Content upload and organization into categories
- Search index configuration enabling comprehensive discovery
- User account creation with role-based permissions
- Interface customization reflecting organizational identity
- Multimedia optimization ensuring smooth playback
- Accessibility feature activation and testing
Quality Assurance and Testing
- Comprehensive functional testing across all features
- User scenario testing with diverse test participants
- Search functionality verification with various query types
- Navigation pathway evaluation ensuring intuitive flow
- Performance testing under load conditions
- Accessibility testing with assistive technologies
- Issue resolution before public launch
Phase 4: Launch and Community Engagement (Weeks 17+)
Public rollout requires promotional support:
Soft Launch Activities
- Staff training on operation and basic troubleshooting
- Limited audience release enabling technical refinement
- Early feedback collection identifying improvement opportunities
- Monitoring system performance and usage patterns
- Documentation creation including user guides
- Internal advocate development promoting displays
Public Launch Promotion
- Announcement through institutional communications channels
- Press release distribution to local media
- Launch event hosting inviting stakeholders
- Social media campaign encouraging exploration
- Integration into admission materials and visitor guides
- Signage directing attention to displays
- Demonstration videos showing how to engage
Ongoing Operations and Enhancement
- Regular content update schedule adding materials systematically
- Usage analytics review identifying popular content and improvement opportunities
- Community feedback collection through surveys and suggestion systems
- Contributor training supporting distributed content creation
- Technical maintenance ensuring optimal display performance
- Periodic content audits verifying accuracy and relevance
- Milestone celebrations acknowledging contributors and demonstrating value

Successful launches create positive community impressions while establishing sustainable operational patterns
Measurement Block: Evaluating Interactive Signage Effectiveness
Systematic assessment demonstrates program value while guiding continuous improvement.
Quantitative Usage Metrics
Analytics dashboards reveal engagement patterns:
Interaction and Engagement Statistics
- Total daily interactions tracking usage frequency
- Average session duration indicating engagement depth
- Unique versus return visitors showing sustained interest
- Peak usage times informing content scheduling
- Interactions per visitor revealing engagement intensity
- Completion rates for multi-screen content pathways
- Abandonment points identifying usability issues
Content Popularity Analysis
- Most-viewed profiles identifying resonant content
- Search query frequency revealing visitor interests
- Video completion rates showing compelling multimedia
- Category popularity indicating subject matter appeal
- Navigation pathways exposing discovery patterns
- Feature utilization measuring interactive element use
- Share frequency indicating promotion-worthy content
Technical Performance Indicators
- System uptime percentages ensuring reliability
- Load times affecting user experience quality
- Error rates requiring interface refinement
- Network performance impacting content delivery
- Device compatibility across different platforms
- Browser functionality ensuring universal access
Organizations discover which content generates sustained engagement, identify gaps requiring development, understand natural navigation patterns, and validate technology investment effectiveness.
Qualitative Impact Assessment
Subjective evaluation complements quantitative measurement:
Visitor Satisfaction Indicators
- Survey responses rating usefulness and satisfaction
- Observational studies documenting interaction patterns
- Comment analysis revealing appreciation and frustrations
- Staff feedback reporting visitor reactions
- Social media mentions demonstrating organic promotion
- Testimonials documenting specific success stories
Organizational Benefits
- Information request reductions at reception desks
- Staff time savings redirected to higher-value activities
- Recognition capacity expansion celebrating more individuals
- Community connection strengthening through heritage presentation
- Recruitment impact on prospective member decisions
- Donor satisfaction with appropriate acknowledgment
- Alumni engagement maintaining graduate relationships
Behavioral Changes
- Dwell time increases in target locations
- Return visit frequency among regular users
- Information retention improvements from interactive learning
- Way-finding success reducing confusion and staff inquiries
- Social interactions as visitors explore together
- Content sharing extending reach beyond physical visitors
Combined quantitative and qualitative assessment provides comprehensive understanding of interactive signage contribution to institutional goals.
Understanding comprehensive approaches to recognition program measurement helps organizations validate investments and demonstrate return.
Advanced Strategies for Maximum Interactive Impact
Mature programs enhance effectiveness through sophisticated approaches.
Personalization and Adaptive Content
Tailored experiences increase engagement:
User Profiles and Preferences
- Account creation enabling personalized experiences
- Saved favorites for content of particular interest
- Search history supporting return visitor navigation
- Recommended content based on interaction patterns
- Language preferences maintaining consistency
- Accessibility settings persisting across sessions
Context-Aware Programming
- Time-based content relevant to current periods or seasons
- Location-specific information for multi-display installations
- Audience-adapted complexity levels based on demonstrated engagement
- Event-proximate promotion as activities approach
- Anniversary commemorations on relevant dates
- Weather-responsive content when appropriate
Gamification and Interactive Learning
Game mechanics encourage exploration:
Engagement Mechanics
- Scavenger hunts guiding visitors through content systematically
- Quiz features testing knowledge and reinforcing learning
- Collection challenges encouraging comprehensive discovery
- Leaderboards recognizing top explorers or high scorers
- Achievement badges rewarding milestones and sustained engagement
- Virtual rewards unlocking exclusive content for active participants
Schools implementing digital recognition programs discover that gamification particularly resonates with student audiences.
Multi-Device Integration
Seamless experiences span platforms:
Cross-Platform Continuity
- Personal device integration extending displays to smartphones
- QR codes connecting physical displays to online content
- Bookmark synchronization enabling home follow-up after visits
- Social sharing amplifying reach through visitor networks
- Email content delivery for materials of particular interest
- Mobile apps complementing physical installations
Hybrid Physical-Digital Experiences
- Augmented reality overlaying digital information on physical artifacts
- Mobile-triggered content launching from physical prompts
- Remote access enabling pre-visit planning
- Post-visit engagement maintaining connections
- Community contribution through personal device submissions

Integrated systems provide consistent experiences across interactive displays, websites, and mobile devices seamlessly
Overcoming Common Interactive Signage Challenges
Learning from frequent obstacles helps organizations avoid expensive mistakes:
Challenge 1: Generic Digital Signage for Interactive Applications
The Problem: Organizations purchase broadcast digital signage platforms designed for passive viewing, then struggle to create effective interactive experiences because software wasn’t built for touchscreen engagement. Limited content capacity, poor search functionality, and interfaces designed for passive viewing rather than active exploration frustrate users and administrators alike.
The Solution: Distinguish between broadcast signage appropriate for announcements and purpose-built interactive platforms designed for exploration. Organizations needing comprehensive content libraries, robust search, intuitive navigation, and sustained engagement should evaluate specialized systems rather than attempting to repurpose generic signage for applications it wasn’t designed to support.
Challenge 2: Insufficient Launch Content
The Problem: Organizations install impressive hardware but launch with minimal content, creating disappointing first impressions that persist even after libraries expand. Sparse recognition sections, limited photo archives, and shallow information depth fail to demonstrate interactive advantages, generating skepticism about technology value.
The Solution: Develop comprehensive launch content before installation rather than treating displays as empty containers to fill eventually. Better to delay launch ensuring adequate content than installing systems generating negative impressions difficult to overcome. Prioritize 50-100 recognition profiles, 200-300 historical photos, and multiple content categories rather than launching with placeholder materials.
Challenge 3: Poor Location Placement
The Problem: Displays installed in low-traffic locations or areas where visitors lack discretionary time fail to generate expected engagement regardless of content quality or interface design. Beautiful installations positioned where nobody stops become expensive decorations rather than valuable engagement tools.
The Solution: Prioritize locations where visitors naturally congregate with available attention: lobbies with seating areas, cafeterias during meal periods, waiting areas outside offices, or gathering spaces before events. Conduct traffic pattern analysis and dwell time observation before committing to expensive installations in suboptimal locations.
Challenge 4: Unsustainable Content Management
The Problem: Organizations assume existing staff will maintain displays “in spare time” without allocating dedicated hours or implementing distributed contribution models. Content stagnates showing increasingly outdated information as updates become neglected additions to already-full workloads.
The Solution: Either designate specific staff with protected time for content management, implement distributed models leveraging multiple contributors, or engage professional content services providing ongoing support. Realistic capacity assessment prevents promising starts deteriorating into abandoned programs showing static content that users learn to ignore.
Understanding efficient content management strategies helps organizations maintain display relevance across years of operation.
Interactive Digital Signage as Strategic Institutional Asset
Interactive digital signage represents far more than technology adoption—it constitutes strategic investment in visitor engagement, operational efficiency, recognition capacity expansion, and measurable impact delivering value across multiple organizational priorities simultaneously.
Every organization possesses stories worth sharing, achievements deserving celebration, and information requiring effective communication. Every visitor benefits from engaging experiences enabling self-directed exploration at personal pace and depth. Every staff member gains operational efficiency when routine information requests decrease through effective self-service access. Every community member deserves recognition celebrating contributions that traditional physical displays cannot accommodate due to space limitations.
The advantages interactive displays provide over passive signage—extended engagement creating meaningful experiences, unlimited content capacity eliminating recognition constraints, self-service information access reducing operational burden, measurable analytics demonstrating value, flexible content enabling regular updates without physical modifications, and comprehensive accessibility serving diverse audiences—make interactivity the sensible strategy for organizations committed to effective communication while preserving community heritage.
Successful implementations require systematic approaches explored throughout this guide—establishing clear goals aligning technology with institutional priorities, selecting appropriate platforms matching functional requirements with budget realities, developing comprehensive content creating strong launch impressions, strategically placing displays where visitors naturally engage, implementing sustainable content management distributing responsibility appropriately, measuring success demonstrating program value, and committing to continuous improvement informed by usage analytics and community feedback.
Ready to transform visitor engagement through interactive digital signage? Modern solutions like Rocket Alumni Solutions provide purpose-built platforms specifically designed for recognition, heritage preservation, and interactive engagement—combining unlimited content capacity with intuitive touchscreen interfaces that make comprehensive programs accessible without overwhelming technology teams or requiring ongoing custom development.
Whether launching first interactive installations or enhancing existing static signage with engagement capabilities, success requires balancing compelling content with intuitive navigation, professional presentation with authentic storytelling, distributed contribution with quality standards, and comprehensive launch development with sustainable ongoing operations. Solutions designed specifically for recognition and engagement deliver superior results compared to generic platforms requiring extensive customization for applications they weren’t built to support.
Your organization’s achievements deserve presentation matching their significance—accessible to all visitors regardless of ability or background, searchable by anyone curious about specific topics or individuals, enriched with comprehensive multimedia context explaining why accomplishments matter, professionally designed reflecting organizational character and values, continuously expanding as new materials and achievements emerge, and strategically integrated supporting communication, recruitment, advancement, and community connection goals simultaneously.
Begin your interactive signage journey today by convening planning teams representing diverse organizational perspectives, assessing visitor needs and institutional priorities, researching technology solutions matching identified requirements, establishing realistic budgets and timelines accounting for comprehensive content development, and committing to systematic implementation delivering steady progress toward comprehensive visitor engagement serving current audiences and future generations.
The strategies, technologies, and best practices explored throughout this guide provide everything needed to transform static communication into dynamic interactive experiences that fulfill organizational missions while delighting visitors, strengthening community connections, celebrating achievements comprehensively, and demonstrating measurable return on technology investments through sustained engagement and operational efficiency gains.